
")

OVERLAND PARK, Kan.--(BUSINESS WIRE)--Sprint Corporation (NYSE:S) today reported operating results for the third fiscal quarter of 2015, including growth in postpaid phone customers for the second consecutive quarter with the highest net additions in three years at 366,000, the lowest-ever postpaid churn for a third quarter at 1.62 percent, and the highest postpaid net ports on record. The company also reported net operating revenue of $8.1 billion, operating loss of $197 million, and Adjusted EBITDA* of $1.9 billion, and is raising its fiscal year 2015 Adjusted EBITDA* guidance from the previous expectation of $6.8 billion to $7.1 billion to a range of $7.7 billion to $8 billion. In addition, the company’s preliminary estimate for fiscal year 2016 Adjusted EBITDA* is approximately $9.5 billion to $10 billion.
“It’s clear from our quarterly results that we are making great progress on achieving our goals,” said Sprint CEO Marcelo Claure. “Revenue has stabilized, costs are coming out faster than expected, postpaid phone net additions were the highest in three years, postpaid churn was the lowest-ever for a third quarter, and the network is performing at best-ever levels.”
Building Momentum on Cost Reduction Effort
Sprint remains on track to exceed its cost reduction target for fiscal 2015 and has realized a nearly $800 million reduction in cost of service and selling, general, and administrative expenses year-to-date, including $500 million in the third quarter. Sprint continues to progress toward a sustainable reduction of $2 billion or more of run rate operating expenses exiting fiscal 2016 and expects approximately $1 billion of transformation program costs, which are expected to be split relatively evenly between operating expenses and capital expenditures, to be incurred across fiscal 2015 and 2016 to achieve that run rate benefit.
“Our transformation is taking hold and the momentum is accelerating,” said Sprint CFO Tarek Robbiati. “Most importantly, we expect these cost reductions to be achieved without compromising network quality or impacting the customer experience.”
Quarterly Financial Results
- Net operating revenues of $8.1 billion decreased 10 percent year-over-year, but have stabilized over the last three quarters, and grew two percent sequentially. The year-over-year decline was due to lower wireless service revenues, primarily related to customer shifts to rate plans associated with device financing options, and lower equipment revenues due to a shift from installment billing and subsidized sales, which recognize more revenue at the point of sale, to leasing sales, which recognize revenues over time.
- Wireless service revenues plus installment plan billings and lease revenue of $7.1 billion increased one percent from the prior year period, primarily because of higher lease revenue and growth in postpaid phone customers.
- Consolidated Adjusted EBITDA* of $1.9 billion improved from the prior year period, as expense reductions more than offset the decline in operating revenues. Total expenses improved primarily because of lower cost of product expenses related to device leasing options for which the associated cost is recorded as depreciation expense, and $500 million of lower selling, general, and administrative expenses.
- Operating loss of $197 million included $209 million of severance and exit costs and compared to an operating loss of $2.5 billion in the year-ago quarter, an improvement of approximately $2.3 billion. Adjusting for the $209 million of severance and exit costs in the current quarter and a non-cash impairment charge of approximately $2.1 billion in the prior year quarter, operating loss would have improved by approximately $400 million year-over-year.
- Net loss of $836 million, or $0.21 per share, compared to a net loss of $2.4 billion, or $0.60 per share, in the year-ago period, an improvement of approximately $1.5 billion. Adjusting for the aforementioned severance and exit costs and impairment charge, net loss would have improved by approximately $300 million year-over-year, or $0.08 per share.
Positive Postpaid Phone Net Additions Help Stabilize Top Line
Sprint continues to focus on attracting and retaining more postpaid phone customers by providing a compelling value proposition, including the recently introduced 50 percent off Verizon, AT&T and T-Mobile rate plans promotion, which has been extended to Feb. 11 because of its popularity. A better network experience has also resulted in dramatic year-over-year improvements in postpaid churn. For the second quarter in a row, the company reported positive postpaid phone net additions and posted year-over-year growth in wireless service revenues plus installment plan billings and lease revenue, which is a better representation of the total service and equipment charges on its customers’ monthly bills.
The company also reported the following Sprint platform results, which reflect its focus on higher value postpaid connections:
- Total net additions were 491,000 compared to 967,000 in the prior year quarter – a decline of 476,000 year-over-year.
- Postpaid net additions of 501,000 compared to 30,000 in the prior year quarter – an improvement of 471,000 year-over-year.
- Postpaid phone net additions were 366,000 compared to net losses of 205,000 in the prior year quarter – an improvement of 571,000 year-over-year.
- Prepaid net losses of 491,000 compared to net additions of 410,000 in the prior year quarter – a decline of 901,000 year-over-year.
- Based on the success of the base loyalty program that the company implemented last quarter for Boost and Virgin, it has decided to implement the program more broadly for its prepaid base. As a result, the company will report these customers as part of its prepaid base and has adjusted the 175,000 previously recorded last quarter as postpaid back into prepaid for better comparability across periods.
- Wholesale and affiliate net additions of 481,000 compared to 527,000 in the prior year quarter – a decline of 46,000 year-over-year.
Company Delivers on Funding Initiatives with More to Come
Total liquidity was $6 billion at the end of the quarter, including $2.2 billion of cash, cash equivalents and short-term investments, $3 billion of undrawn borrowing capacity under the revolving bank credit facility, and approximately $800 million of undrawn availability under the receivables facility. In addition, the company had approximately $600 million of availability under vendor financing agreements that can be used toward the purchase of 2.5 GHz network equipment, with approximately $500 million of additional availability coming in April. During the quarter, the company closed two significant transactions that immediately improved its liquidity position.
- Completed the first sale-leaseback transaction with Mobile Leasing Solutions, LLC providing a $1.1 billion cash infusion, as well as creating a repeatable structure for the company to mitigate the working capital impacts associated with the leasing model. The company expects to execute future transactions generally on a quarterly basis, and expects to receive proceeds totaling $3 billion to $4 billion in fiscal 2016, depending on the amount of qualified leasing sales to its customers.
- Amended existing receivables facility to include the sale of certain future lease receivables, thus increasing the maximum funding limit by $1 billion to a total of $4.3 billion. These future lease receivables are related to devices not included in the aforementioned sale-leaseback transaction with Mobile Leasing Solutions, LLC.
Sprint continues to use its assets to help fund the business and fuel future growth. Together with SoftBank and its partners, the company is establishing a network-related financing entity that could provide $3 billion to $5 billion of incremental funding in fiscal 2016. This entity is expected to raise proceeds from Sprint’s existing radio access equipment, as well as a combination of new assets associated with the network densification and a small portion of its spectrum portfolio. Sprint expects the first transaction to close by the middle of calendar 2016. Together with existing facilities, these sources of liquidity are expected to fund the transformation and repayment of all maturities that come due over the next year.
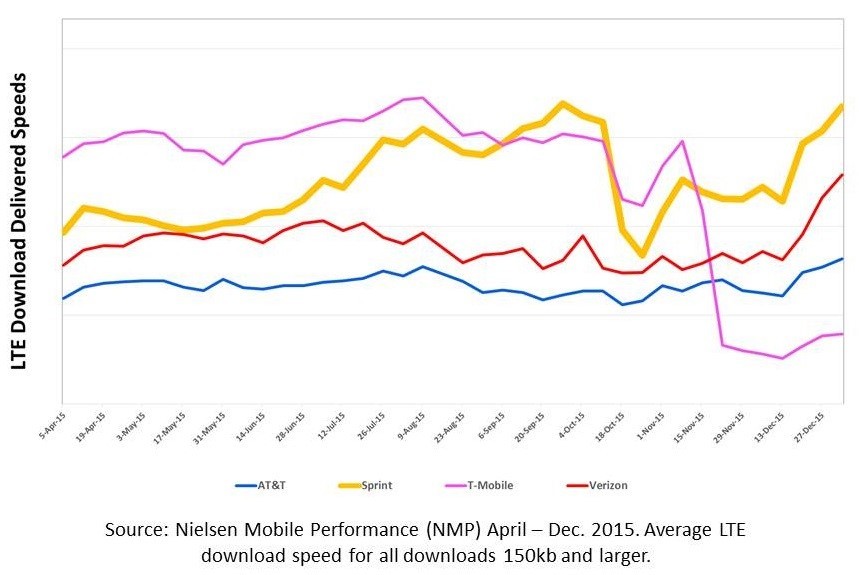
LTE Plus Network Delivers Fastest Download Speeds
Sprint remains focused on building a network that delivers the consistent reliability, capacity and speed that customers demand, and its recent deployment of two-channel (2x20 MHz) carrier aggregation in the 2.5 GHz band is driving network performance that is beating the competition. An analysis of Nielsen Mobile Performance crowd-sourced data from October through December 2015 showed that Sprint’s LTE Plus Network beat Verizon, AT&T and T-Mobile by delivering the fastest LTE download speeds. The company has deployed its LTE Plus Network in more than 150 major markets across the country and has plans for expansion in the coming months.
Additionally, independent mobile analytics firm RootMetrics® awarded Sprint a company record 212 first-place (outright or shared) RootScore® Awards for overall, reliability, speed, data, call, or text network performance in the 125 metro markets measured in the second half of 2015, beating T-Mobile for the first time ever and receiving 57 percent more awards than the prior year periodi. The company also saw median downlink speeds in these metro markets more than triple on average from the first half of 2014 testing period and measured the fastest median download speeds of any carrier in 16 cities, including Austin, Dallas, Denver, Houston, Indianapolis, Kansas City, and Phoenix.
The company remains committed to its plan of significantly densifying the network through the deployment of small cells to further improve network performance and customer experience.
Financial Outlook
- As a result of accelerated cost reductions, the company is raising its guidance for fiscal year 2015 Adjusted EBITDA* from its previous expectation of $6.8 billion to $7.1 billion to a range of $7.7 billion to $8 billion.
- The company is also raising its guidance for fiscal year 2015 operating income from its previous expectation of an operating loss of $50 million to $250 million to operating income of $100 million to $300 million.
- The company continues to expect fiscal year 2015 cash capital expenditures to be approximately $5 billion, excluding the impact of leased devices sold through indirect channels.
- The company’s preliminary estimate for fiscal year 2016 Adjusted EBITDA* is approximately $9.5 billion to $10 billion.
Conference Call and Webcast
- Date/Time: 8:30 a.m. (ET) Tuesday, Jan. 26, 2016
-
Call-in Information
- U.S./Canada: 866-360-1063 (ID: 21719348)
- International: 706-634-7849 (ID: 21719348)
- Webcast available via the Internet at www.sprint.com/investors
- Additional information about results, including the “Quarterly Investor Update,” is available on our Investor Relations website
| Wireless Operating Statistics (Unaudited) | |||||||||||||||||
| Quarter To Date | Year To Date | ||||||||||||||||
| 12/31/15 | 9/30/15 | 12/31/14 | 12/31/15 | 12/31/14 | |||||||||||||
| Sprint platform (1): | |||||||||||||||||
| Net additions (losses) (in thousands) | |||||||||||||||||
| Postpaid | 501 | 378 | 30 | 1,189 | (423 | ) | |||||||||||
| Prepaid | (491 | ) | (188 | ) | 410 | (1,045 | ) | (97 | ) | ||||||||
| Wholesale and affiliate | 481 | 866 | 527 | 2,078 | 1,857 | ||||||||||||
| Total Sprint platform wireless net additions | 491 | 1,056 | 967 | 2,222 | 1,337 | ||||||||||||
| End of period connections (in thousands) | |||||||||||||||||
| Postpaid | 30,895 | 30,394 | 29,495 | 30,895 | 29,495 | ||||||||||||
| Prepaid | 14,661 | 15,152 | 15,160 | 14,661 | 15,160 | ||||||||||||
| Wholesale and affiliate | 12,803 | 12,322 | 10,233 | 12,803 | 10,233 | ||||||||||||
| Total Sprint platform end of period connections | 58,359 | 57,868 | 54,888 | 58,359 | 54,888 | ||||||||||||
| Churn | |||||||||||||||||
| Postpaid | 1.62 | % | 1.54 | % | 2.30 | % | 1.57 | % | 2.18 | % | |||||||
| Prepaid | 5.82 | % | 5.06 | % | 3.94 | % | 5.31 | % | 4.05 | % | |||||||
| Supplemental data - connected devices | |||||||||||||||||
| End of period connections (in thousands) | |||||||||||||||||
| Retail postpaid | 1,676 | 1,576 | 1,180 | 1,676 | 1,180 | ||||||||||||
| Wholesale and affiliate | 7,930 | 7,338 | 5,175 | 7,930 | 5,175 | ||||||||||||
| Total | 9,606 | 8,914 | 6,355 | 9,606 | 6,355 | ||||||||||||
| Supplemental data - total company | |||||||||||||||||
| End of period connections (in thousands) | |||||||||||||||||
| Sprint platform (1) | 58,359 | 57,868 | 54,888 | 58,359 | 54,888 | ||||||||||||
| Transactions (2) | - | 710 | 1,041 | - | 1,041 | ||||||||||||
| Total | 58,359 | 58,578 | 55,929 | 58,359 | 55,929 | ||||||||||||
| Sprint platform ARPU (1) (a) | |||||||||||||||||
| Postpaid | $ | 52.48 | $ | 53.99 | $ | 58.90 | $ | 53.97 | $ | 60.52 | |||||||
| Prepaid | $ | 27.44 | $ | 27.66 | $ | 27.12 | $ | 27.64 | $ | 27.23 | |||||||
|
NON-GAAP RECONCILIATION - ABPA*, POSTPAID PHONE ARPU AND ABPU* (Unaudited) |
|||||||||||||||||
| (Millions, except accounts, connections, ABPA*, ARPU, and ABPU*) | |||||||||||||||||
| Quarter To Date | Year To Date | ||||||||||||||||
| 12/31/15 | 9/30/15 | 12/31/14 | 12/31/15 | 12/31/14 | |||||||||||||
| Sprint platform ABPA* (1) | |||||||||||||||||
| Postpaid service revenue | $ | 4,813 | $ | 4,893 | $ | 5,202 | $ | 14,670 | $ | 16,132 | |||||||
| Add: Installment plan billings and lease revenue | 831 | 694 | 288 | 2,079 | 618 | ||||||||||||
| Total for Sprint platform postpaid connections | $ | 5,644 | $ | 5,587 | $ | 5,490 | $ | 16,749 | $ | 16,750 | |||||||
| Sprint platform postpaid accounts (in thousands) | 11,261 | 11,197 | 11,341 | 11,211 | 11,538 | ||||||||||||
| Sprint platform postpaid ABPA* (b) | $ | 167.11 | $ | 166.26 | $ | 161.35 | $ | 166.00 | $ | 161.27 | |||||||
| Quarter To Date | Year To Date | ||||||||||||||||
| 12/31/15 | 9/30/15 | 12/31/14 | 12/31/15 | 12/31/14 | |||||||||||||
| Sprint platform postpaid phone ARPU and ABPU* (1) | |||||||||||||||||
| Postpaid phone service revenue | $ | 4,529 | $ | 4,608 | $ | 4,933 | $ | 13,819 | $ | 15,323 | |||||||
| Add: Installment plan billings and lease revenue | 802 | 665 | 276 | 1,998 | 588 | ||||||||||||
| Total for Sprint platform postpaid phone connections | $ | 5,331 | $ | 5,273 | $ | 5,209 | $ | 15,817 | $ | 15,911 | |||||||
| Sprint platform postpaid average phone connections (in thousands) | 25,040 | 24,886 | 25,163 | 24,927 | 25,578 | ||||||||||||
| Sprint platform postpaid phone ARPU (a) | $ | 60.30 | $ | 61.71 | $ | 65.35 | $ | 61.60 | $ | 66.57 | |||||||
| Sprint platform postpaid phone ABPU* (c) | $ | 70.99 | $ | 70.62 | $ | 69.01 | $ | 70.51 | $ | 69.12 | |||||||
| (a) ARPU is calculated by dividing service revenue by the sum of the monthly average number of connections in the applicable service category. Changes in average monthly service revenue reflect connections for either the postpaid or prepaid service category who change rate plans, the level of voice and data usage, the amount of service credits which are offered to connections, plus the net effect of average monthly revenue generated by new connections and deactivating connections. |
| Sprint platform postpaid phone ARPU represents revenues related to our postpaid phone connections. |
| (b) Sprint platform postpaid ABPA* is calculated by dividing service revenue earned from connections plus installment plan billings and lease revenue by the sum of the monthly average number of accounts during the period. |
| (c) Sprint platform postpaid phone ABPU* is calculated by dividing postpaid phone service revenue earned from postpaid phone connections plus installment plan billings and lease revenue by the sum of the monthly average number of postpaid phone connections during the period. |
| CONDENSED CONSOLIDATED STATEMENTS OF OPERATIONS (Unaudited) | |||||||||||||||||
| (Millions, except per share data) | |||||||||||||||||
| Quarter To Date | Year To Date | ||||||||||||||||
| 12/31/15 | 9/30/15 | 12/31/14 | 12/31/15 | 12/31/14 | |||||||||||||
| Net operating revenues | |||||||||||||||||
| Service revenue | $ | 6,683 | $ | 6,880 | $ | 7,272 | $ | 20,600 | $ | 22,404 | |||||||
| Equipment revenue | 1,424 | 1,095 | 1,701 | 3,509 | 3,846 | ||||||||||||
| Total net operating revenues | 8,107 | 7,975 | 8,973 | 24,109 | 26,250 | ||||||||||||
| Net operating expenses | |||||||||||||||||
| Cost of services (exclusive of depreciation and amortization below) | 2,348 | 2,453 | 2,330 | 7,194 | 7,279 | ||||||||||||
| Cost of products (exclusive of depreciation and amortization below) | 1,589 | 1,290 | 2,952 | 4,244 | 7,482 | ||||||||||||
| Selling, general and administrative | 2,129 | 2,224 | 2,647 | 6,540 | 7,232 | ||||||||||||
| Depreciation and amortization | 1,865 | 1,743 | 1,320 | 5,196 | 3,895 | ||||||||||||
| Impairments (3) | - | 85 | 2,133 | 85 | 2,133 | ||||||||||||
| Other, net | 373 | 182 | 131 | 548 | 442 | ||||||||||||
| Total net operating expenses | 8,304 | 7,977 | 11,513 | 23,807 | 28,463 | ||||||||||||
| Operating (loss) income | (197 | ) | (2 | ) | (2,540 | ) | 302 | (2,213 | ) | ||||||||
| Interest expense | (546 | ) | (542 | ) | (506 | ) | (1,630 | ) | (1,528 | ) | |||||||
| Other income, net | 4 | 5 | 10 | 13 | 19 | ||||||||||||
| Loss before income taxes | (739 | ) | (539 | ) | (3,036 | ) | (1,315 | ) | (3,722 | ) | |||||||
| Income tax (expense) benefit | (97 | ) | (46 | ) | 657 | (126 | ) | 601 | |||||||||
| Net loss | $ | (836 | ) | $ | (585 | ) | $ | (2,379 | ) | $ | (1,441 | ) | $ | (3,121 | ) | ||
| Basic and diluted net loss per common share | $ | (0.21 | ) | $ | (0.15 | ) | $ | (0.60 | ) | $ | (0.36 | ) | $ | (0.79 | ) | ||
| Weighted average common shares outstanding | 3,970 | 3,969 | 3,957 | 3,969 | 3,950 | ||||||||||||
| Effective tax rate | -13.1 | % | -8.5 | % | 21.6 | % | -9.6 | % | 16.1 | % | |||||||
| NON-GAAP RECONCILIATION - NET LOSS TO ADJUSTED EBITDA* (Unaudited) | |||||||||||||||||
| (Millions) | |||||||||||||||||
| Quarter To Date | Year To Date | ||||||||||||||||
| 12/31/15 | 9/30/15 | 12/31/14 | 12/31/15 | 12/31/14 | |||||||||||||
| Net loss | $ | (836 | ) | $ | (585 | ) | $ | (2,379 | ) | $ | (1,441 | ) | $ | (3,121 | ) | ||
| Income tax expense (benefit) | 97 | 46 | (657 | ) | 126 | (601 | ) | ||||||||||
| Loss before income taxes | (739 | ) | (539 | ) | (3,036 | ) | (1,315 | ) | (3,722 | ) | |||||||
| Other income, net | (4 | ) | (5 | ) | (10 | ) | (13 | ) | (19 | ) | |||||||
| Interest expense | 546 | 542 | 506 | 1,630 | 1,528 | ||||||||||||
| Operating (loss) income | (197 | ) | (2 | ) | (2,540 | ) | 302 | (2,213 | ) | ||||||||
| Depreciation and amortization | 1,865 | 1,743 | 1,320 | 5,196 | 3,895 | ||||||||||||
| EBITDA* (4) | 1,668 | 1,741 | (1,220 | ) | 5,498 | 1,682 | |||||||||||
| Impairments (3) | - | 85 | 2,133 | 85 | 2,133 | ||||||||||||
| Severance and exit costs (5) | 209 | 25 | 22 | 247 | 333 | ||||||||||||
| Litigation (6) | 21 | 157 | 91 | 178 | 91 | ||||||||||||
| Partial pension settlement (7) | - | - | 59 | - | 59 | ||||||||||||
| Reduction in liability - U.S. Cellular asset acquisition (8) | - | - | (41 | ) | (20 | ) | (41 | ) | |||||||||
| Adjusted EBITDA* (4) | $ | 1,898 | $ | 2,008 | $ | 1,044 | $ | 5,988 | $ | 4,257 | |||||||
| Adjusted EBITDA margin* | 28.4 | % | 29.2 | % | 14.4 | % | 29.1 | % | 19.0 | % | |||||||
| Selected items: | |||||||||||||||||
| Cash paid for capital expenditures - network and other | $ | 994 | $ | 1,162 | $ | 1,425 | $ | 3,958 | $ | 3,814 | |||||||
| Cash paid for capital expenditures - leased devices | $ | 607 | $ | 573 | $ | 143 | $ | 1,724 | $ | 143 | |||||||
| WIRELESS STATEMENTS OF OPERATIONS (Unaudited) | |||||||||||||||||
| (Millions) | |||||||||||||||||
| Quarter To Date | Year To Date | ||||||||||||||||
| 12/31/15 | 9/30/15 | 12/31/14 | 12/31/15 | 12/31/14 | |||||||||||||
| Net operating revenues | |||||||||||||||||
| Service revenue | |||||||||||||||||
| Sprint platform (1): | |||||||||||||||||
| Postpaid | $ | 4,813 | $ | 4,893 | $ | 5,202 | $ | 14,670 | $ | 16,132 | |||||||
| Prepaid | 1,224 | 1,259 | 1,215 | 3,783 | 3,633 | ||||||||||||
| Wholesale, affiliate and other | 182 | 185 | 191 | 548 | 535 | ||||||||||||
| Total Sprint platform | 6,219 | 6,337 | 6,608 | 19,001 | 20,300 | ||||||||||||
| Total transactions (2) | 27 | 84 | 124 | 216 | 409 | ||||||||||||
| Total service revenue | 6,246 | 6,421 | 6,732 | $ | 19,217 | $ | 20,709 | ||||||||||
| Equipment revenue | 1,424 | 1,095 | 1,701 | 3,509 | 3,846 | ||||||||||||
| Total net operating revenues | 7,670 | 7,516 | 8,433 | 22,726 | 24,555 | ||||||||||||
| Net operating expenses | |||||||||||||||||
| Cost of services (exclusive of depreciation and amortization below) | 2,031 | 2,111 | 1,902 | 6,147 | 5,939 | ||||||||||||
| Cost of products (exclusive of depreciation and amortization below) | 1,589 | 1,290 | 2,952 | 4,244 | 7,482 | ||||||||||||
| Selling, general and administrative | 2,041 | 2,136 | 2,545 | 6,273 | 6,937 | ||||||||||||
| Depreciation and amortization | 1,812 | 1,694 | 1,259 | 5,046 | 3,703 | ||||||||||||
| Impairments (3) | - | 85 | 1,900 | 85 | 1,900 | ||||||||||||
| Other, net | 353 | 181 | 107 | 526 | 378 | ||||||||||||
| Total net operating expenses | 7,826 | 7,497 | 10,665 | 22,321 | 26,339 | ||||||||||||
| Operating (loss) income | $ | (156 | ) | $ | 19 | $ | (2,232 | ) | $ | 405 | $ | (1,784 | ) | ||||
| WIRELESS NON-GAAP RECONCILIATION (Unaudited) | |||||||||||||||||
| (Millions) | |||||||||||||||||
| Quarter To Date | Year To Date | ||||||||||||||||
| 12/31/15 | 9/30/15 | 12/31/14 | 12/31/15 | 12/31/14 | |||||||||||||
| Operating (loss) income | $ | (156 | ) | $ | 19 | $ | (2,232 | ) | $ | 405 | $ | (1,784 | ) | ||||
| Impairments (3) | - | 85 | 1,900 | 85 | 1,900 | ||||||||||||
| Severance and exit costs (5) | 189 | 24 | 21 | 225 | 292 | ||||||||||||
| Litigation (6) | 21 | 157 | 84 | 178 | 84 | ||||||||||||
| Partial pension settlement (7) | - | - | 43 | - | 43 | ||||||||||||
| Reduction in liability - U.S. Cellular asset acquisition (8) | - | - | (41 | ) | (20 | ) | (41 | ) | |||||||||
| Depreciation and amortization | 1,812 | 1,694 | 1,259 | 5,046 | 3,703 | ||||||||||||
| Adjusted EBITDA* (4) | $ | 1,866 | $ | 1,979 | $ | 1,034 | $ | 5,919 | $ | 4,197 | |||||||
| Adjusted EBITDA margin* | 29.9 | % | 30.8 | % | 15.4 | % | 30.8 | % | 20.3 | % | |||||||
| Selected items: | |||||||||||||||||
| Cash paid for capital expenditures - network and other | $ | 869 | $ | 1,003 | $ | 1,233 | $ | 3,512 | $ | 3,342 | |||||||
| Cash paid for capital expenditures - leased devices | $ | 607 | $ | 573 | $ | 143 | $ | 1,724 | $ | 143 | |||||||
| WIRELINE STATEMENTS OF OPERATIONS (Unaudited) | |||||||||||||||||
| (Millions) | |||||||||||||||||
| Quarter To Date | Year To Date | ||||||||||||||||
| 12/31/15 | 9/30/15 | 12/31/14 | 12/31/15 | 12/31/14 | |||||||||||||
| Net operating revenues | |||||||||||||||||
| Voice | $ | 201 | $ | 212 | $ | 289 | $ | 646 | $ | 910 | |||||||
| Data | 42 | 43 | 52 | 134 | 161 | ||||||||||||
| Internet | 317 | 323 | 333 | 968 | 1,018 | ||||||||||||
| Other | 21 | 31 | 18 | 72 | 57 | ||||||||||||
| Total net operating revenues | 581 | 609 | 692 | 1,820 | 2,146 | ||||||||||||
| Net operating expenses | |||||||||||||||||
| Costs of services (exclusive of depreciation and amortization below) | 466 | 495 | 581 | 1,495 | 1,800 | ||||||||||||
| Selling, general and administrative | 82 | 85 | 100 | 254 | 273 | ||||||||||||
| Depreciation and amortization | 50 | 48 | 59 | 144 | 186 | ||||||||||||
| Impairments (3) | - | - | 233 | - | 233 | ||||||||||||
| Other, net | 20 | 1 | 24 | 22 | 63 | ||||||||||||
| Total net operating expenses | 618 | 629 | 997 | 1,915 | 2,555 | ||||||||||||
| Operating loss | $ | (37 | ) | $ | (20 | ) | $ | (305 | ) | $ | (95 | ) | $ | (409 | ) | ||
| WIRELINE NON-GAAP RECONCILIATION (Unaudited) | |||||||||||||||||
| (Millions) | |||||||||||||||||
| Quarter To Date | Year To Date | ||||||||||||||||
| 12/31/15 | 9/30/15 | 12/31/14 | 12/31/15 | 12/31/14 | |||||||||||||
| Operating loss | $ | (37 | ) | $ | (20 | ) | $ | (305 | ) | $ | (95 | ) | $ | (409 | ) | ||
| Impairments (3) | - | - | 233 | - | 233 | ||||||||||||
| Severance and exit costs (5) | 20 | 1 | 2 | 22 | 41 | ||||||||||||
| Litigation (6) | - | - | 6 | - | 6 | ||||||||||||
| Partial pension settlement (7) | - | - | 16 | - | 16 | ||||||||||||
| Depreciation and amortization | 50 | 48 | 59 | 144 | 186 | ||||||||||||
| Adjusted EBITDA* | $ | 33 | $ | 29 | $ | 11 | $ | 71 | $ | 73 | |||||||
| Adjusted EBITDA margin* | 5.7 | % | 4.8 | % | 1.6 | % | 3.9 | % | 3.4 | % | |||||||
| Selected items: | |||||||||||||||||
| Cash paid for capital expenditures - network and other | $ | 74 | $ | 63 | $ | 81 | $ | 205 | $ | 205 | |||||||
| CONDENSED CONSOLIDATED CASH FLOW INFORMATION (Unaudited) | ||||||||||||||||||
| (Millions) | ||||||||||||||||||
| Year To Date | ||||||||||||||||||
| 12/31/15 | 12/31/14 | |||||||||||||||||
| Operating activities | ||||||||||||||||||
| Net loss | $ | (1,441 | ) | $ | (3,121 | ) | ||||||||||||
| Impairments (3) | 85 | 2,133 | ||||||||||||||||
| Depreciation and amortization | 5,196 | 3,895 | ||||||||||||||||
| Provision for losses on accounts receivable | 385 | 730 | ||||||||||||||||
| Share-based and long-term incentive compensation expense | 58 | 89 | ||||||||||||||||
| Deferred income tax expense (benefit) | 120 | (634 | ) | |||||||||||||||
| Amortization of long-term debt premiums, net | (236 | ) | (226 | ) | ||||||||||||||
| Loss on disposal of leased assets | 143 | - | ||||||||||||||||
| Other changes in assets and liabilities: | ||||||||||||||||||
| Accounts and notes receivable | (1,351 | ) | (1,356 | ) | ||||||||||||||
| Inventories and other current assets | (278 | ) | (1,044 | ) | ||||||||||||||
| Accounts payable and other current liabilities | (811 | ) | 1,183 | |||||||||||||||
| Non-current assets and liabilities, net | 137 | (281 | ) | |||||||||||||||
| Other, net | 596 | 106 | ||||||||||||||||
| Net cash provided by operating activities | 2,603 | 1,474 | ||||||||||||||||
| Investing activities | ||||||||||||||||||
| Capital expenditures - network and other | (3,958 | ) | (3,814 | ) | ||||||||||||||
| Capital expenditures - leased devices | (1,724 | ) | (143 | ) | ||||||||||||||
| Expenditures relating to FCC licenses | (75 | ) | (121 | ) | ||||||||||||||
| Reimbursements relating to FCC licenses | - | 95 | ||||||||||||||||
| Change in short-term investments, net | 125 | 966 | ||||||||||||||||
| Proceeds from sales of assets and FCC licenses | 36 | 114 | ||||||||||||||||
| Proceeds from sale-leaseback transaction | 1,136 | - | ||||||||||||||||
| Other, net | (25 | ) | (9 | ) | ||||||||||||||
| Net cash used in investing activities | (4,485 | ) | (2,912 | ) | ||||||||||||||
| Financing activities | ||||||||||||||||||
| Proceeds from debt and financings | 755 | 300 | ||||||||||||||||
| Repayments of debt, financing and capital lease obligations | (727 | ) | (390 | ) | ||||||||||||||
| Debt financing costs | (1 | ) | (37 | ) | ||||||||||||||
| Proceeds from issuance of common stock, net | 10 | 50 | ||||||||||||||||
| Other, net | 10 | - | ||||||||||||||||
| Net cash provided by (used in) financing activities | 47 | (77 | ) | |||||||||||||||
| Net decrease in cash and cash equivalents | (1,835 | ) | (1,515 | ) | ||||||||||||||
| Cash and cash equivalents, beginning of period | 4,010 | 4,970 | ||||||||||||||||
| Cash and cash equivalents, end of period | $ | 2,175 | $ | 3,455 | ||||||||||||||
| RECONCILIATION TO CONSOLIDATED FREE CASH FLOW* (NON-GAAP) (Unaudited) | ||||||||||||||||||
| (Millions) | ||||||||||||||||||
| Quarter To Date | Year To Date | |||||||||||||||||
| 12/31/15 | 9/30/15 | 12/31/14 | 12/31/15 | 12/31/14 | ||||||||||||||
| Net cash provided by (used in) operating activities | $ | 806 | $ | 1,669 | $ | (233 | ) | $ | 2,603 | $ | 1,474 | |||||||
| Capital expenditures - network and other | (994 | ) | (1,162 | ) | (1,425 | ) | (3,958 | ) | (3,814 | ) | ||||||||
| Capital expenditures - leased devices | (607 | ) | (573 | ) | (143 | ) | (1,724 | ) | (143 | ) | ||||||||
| Expenditures relating to FCC licenses, net | (30 | ) | (19 | ) | (42 | ) | (75 | ) | (26 | ) | ||||||||
| Proceeds from sales of assets and FCC licenses | 32 | 3 | 13 | 36 | 114 | |||||||||||||
| Other investing activities, net | (4 | ) | (18 | ) | (3 | ) | (25 | ) | (9 | ) | ||||||||
| Free cash flow* | $ | (797 | ) | $ | (100 | ) | $ | (1,833 | ) | $ | (3,143 | ) | $ | (2,404 | ) | |||
| CONDENSED CONSOLIDATED BALANCE SHEETS (Unaudited) | ||||||||
| (Millions) | ||||||||
| 12/31/15 | 3/31/15 | |||||||
| ASSETS | ||||||||
| Current assets | ||||||||
| Cash and cash equivalents | $ | 2,175 | $ | 4,010 | ||||
| Short-term investments | 41 | 166 | ||||||
| Accounts and notes receivable, net | 1,033 | 2,290 | ||||||
| Device and accessory inventory | 995 | 1,359 | ||||||
| Deferred tax assets | - | 62 | ||||||
| Prepaid expenses and other current assets | 2,317 | 1,890 | ||||||
| Total current assets | 6,561 | 9,777 | ||||||
| Property, plant and equipment, net | 20,645 | 19,721 | ||||||
| Goodwill | 6,575 | 6,575 | ||||||
| FCC licenses and other | 40,052 | 39,987 | ||||||
| Definite-lived intangible assets, net | 4,807 | 5,893 | ||||||
| Other assets | 911 | 1,077 | ||||||
| Total assets | $ | 79,551 | $ | 83,030 | ||||
| LIABILITIES AND STOCKHOLDERS' EQUITY | ||||||||
| Current liabilities | ||||||||
| Accounts payable | $ | 3,078 | $ | 4,347 | ||||
| Accrued expenses and other current liabilities | 4,474 | 5,293 | ||||||
| Current portion of long-term debt, financing and capital lease obligations | 3,324 | 1,300 | ||||||
| Deferred tax liabilities | 186 | - | ||||||
| Total current liabilities | 11,062 | 10,940 | ||||||
| Long-term debt, financing and capital lease obligations | 30,429 | 32,531 | ||||||
| Deferred tax liabilities | 13,773 | 13,898 | ||||||
| Other liabilities | 3,954 | 3,951 | ||||||
| Total liabilities | 59,218 | 61,320 | ||||||
| Stockholders' equity | ||||||||
| Common stock | 40 | 40 | ||||||
| Treasury shares, at cost | - | (7 | ) | |||||
| Paid-in capital | 27,536 | 27,468 | ||||||
| Accumulated deficit | (6,824 | ) | (5,383 | ) | ||||
| Accumulated other comprehensive loss | (419 | ) | (408 | ) | ||||
| Total stockholders' equity | 20,333 | 21,710 | ||||||
| Total liabilities and stockholders' equity | $ | 79,551 | $ | 83,030 | ||||
| NET DEBT* (NON-GAAP) (Unaudited) | ||||||||
| (Millions) | ||||||||
| 12/31/15 | 3/31/15 | |||||||
| Total debt | $ | 33,753 | $ | 33,831 | ||||
| Less: Cash and cash equivalents | (2,175 | ) | (4,010 | ) | ||||
| Less: Short-term investments | (41 | ) | (166 | ) | ||||
| Net debt* | $ | 31,537 | $ | 29,655 | ||||
| SCHEDULE OF DEBT (Unaudited) | ||||||||||
| (Millions) | ||||||||||
| 12/31/15 | ||||||||||
|
ISSUER |
COUPON | MATURITY | PRINCIPAL | |||||||
| Sprint Corporation | ||||||||||
| 7.25% Notes due 2021 | 7.250 | % | 09/15/2021 | $ | 2,250 | |||||
| 7.875% Notes due 2023 | 7.875 | % | 09/15/2023 | 4,250 | ||||||
| 7.125% Notes due 2024 | 7.125 | % | 06/15/2024 | 2,500 | ||||||
| 7.625% Notes due 2025 | 7.625 | % | 02/15/2025 | 1,500 | ||||||
| Sprint Corporation | 10,500 | |||||||||
| Sprint Communications, Inc. | ||||||||||
| Export Development Canada Facility (Tranche 4) | 5.556 | % | 12/15/2017 | 250 | ||||||
| Export Development Canada Facility (Tranche 3) | 3.783 | % | 12/17/2019 | 300 | ||||||
| 6% Senior notes due 2016 | 6.000 | % | 12/01/2016 | 2,000 | ||||||
| 9.125% Senior notes due 2017 | 9.125 | % | 03/01/2017 | 1,000 | ||||||
| 8.375% Senior notes due 2017 | 8.375 | % | 08/15/2017 | 1,300 | ||||||
| 9% Guaranteed notes due 2018 | 9.000 | % | 11/15/2018 | 3,000 | ||||||
| 7% Guaranteed notes due 2020 | 7.000 | % | 03/01/2020 | 1,000 | ||||||
| 7% Senior notes due 2020 | 7.000 | % | 08/15/2020 | 1,500 | ||||||
| 11.5% Senior notes due 2021 | 11.500 | % | 11/15/2021 | 1,000 | ||||||
| 9.25% Debentures due 2022 | 9.250 | % | 04/15/2022 | 200 | ||||||
| 6% Senior notes due 2022 | 6.000 | % | 11/15/2022 | 2,280 | ||||||
| Sprint Communications, Inc. | 13,830 | |||||||||
| Sprint Capital Corporation | ||||||||||
| 6.9% Senior notes due 2019 | 6.900 | % | 05/01/2019 | 1,729 | ||||||
| 6.875% Senior notes due 2028 | 6.875 | % | 11/15/2028 | 2,475 | ||||||
| 8.75% Senior notes due 2032 | 8.750 | % | 03/15/2032 | 2,000 | ||||||
| Sprint Capital Corporation | 6,204 | |||||||||
| Clearwire Communications LLC | ||||||||||
| 14.75% First-priority senior secured notes due 2016 | 14.750 | % | 12/01/2016 | 300 | ||||||
| 8.25% Exchangeable notes due 2040 | 8.250 | % | 12/01/2040 | 629 | ||||||
| Clearwire Communications LLC | 929 | |||||||||
| Secured equipment credit facilities | 1.991% - 2.745% | 2017 - 2021 | 960 | |||||||
| Tower financing obligation | 6.098% | 08/31/2021 | 237 | |||||||
| Capital lease obligations and other | 2.348% - 10.517% | 2016 - 2023 | 231 | |||||||
| Total principal | 32,891 | |||||||||
| Net premiums | 862 | |||||||||
| Total debt | $ | 33,753 | ||||||||
| NOTES TO THE FINANCIAL INFORMATION (Unaudited) | ||
| (1) | Sprint platform refers to the Sprint network that supports the wireless service we provide through our multiple brands. | |
| (2) | Postpaid and prepaid connections from transactions are defined as retail postpaid and prepaid connections acquired from Clearwire in July 2013 who had not deactivated or been recaptured on the Sprint platform. | |
| (3) | During the second quarter of fiscal year 2015, we recorded $85 million of asset impairments primarily related to network development costs that are no longer relevant as a result of changes in the Company's network plans. For the third quarter of fiscal year 2014, impairment losses were recorded after determining that the carrying value exceeded estimated fair value of both the Sprint trade name and Wireline asset group, which consists primarily of property, plant and equipment. | |
| (4) |
As more of our customers elect to lease a device rather than
purchasing one under our subsidized program, there is a positive
impact to EBITDA* and Adjusted EBITDA* primarily due to the fact the
cost of the device is not recorded as cost of products but rather is
depreciated over the customer lease term. Under our device leasing
program for the direct channel, devices are transferred from
inventory to property and equipment and the cost of the leased
device is recognized as depreciation expense over the customer lease
term to an estimated residual value. The customer payments are
recognized as revenue over the term of the lease. Under our
subsidized program, the cash received from the customer for the
device is recognized as equipment revenue at the point of sale and
the cost of the device is recognized as cost of products. During the
three and nine-month periods ended December 31, 2015, we leased
devices through our Sprint direct channels totaling approximately
$1.0 and $2.6 billion, respectively, which would have increased cost
of products and reduced EBITDA* if they had been purchased under our
subsidized program. Also, during the three and nine-month periods
ended December 31, 2015, the equipment revenue derived from
customers electing to finance their devices through device leasing
or installment billing programs was 58% and 59%, respectively, while
the remainder of total equipment revenue was derived from customers
purchasing devices under our subsidized program as compared to 17%
and 16% in prior periods, respectively.
The impact to EBITDA* and Adjusted EBITDA* resulting from the sale of devices under our installment billing program is neutral except for the impact from the time value of money element related to the imputed interest on the installment receivable. |
|
| (5) | Severance and exit costs consist of lease exit costs primarily associated with tower and cell sites, access exit costs related to payments that will continue to be made under our backhaul access contracts for which we will no longer be receiving any economic benefit, and severance costs associated with reduction in our work force. | |
| (6) | For the third and second quarters of fiscal year 2015 and third quarter of fiscal year 2014, litigation activity is a result of unfavorable developments in connection with pending litigation. | |
| (7) | The partial pension settlement resulted from amounts paid to eligible terminated participants who voluntarily elected to receive lump sum distributions as a result of an approved plan amendment to the Sprint Retirement Pension Plan by the Board of Directors in June 2014. | |
| (8) | As a result of the U.S. Cellular asset acquisition, we recorded a liability related to network shut-down costs, which primarily consisted of lease exit costs, for which we agreed to reimburse U.S. Cellular. During the third quarter of fiscal year 2014, we identified favorable trends in actual costs and, as a result, reduced the liability resulting in a gain of approximately $41 million. During the first quarter of fiscal year 2015, we revised our estimate and, as a result, reduced the liability resulting in approximately $20 million of income. | |
*FINANCIAL MEASURES
Sprint provides financial measures determined in accordance with GAAP and adjusted GAAP (non-GAAP). The non-GAAP financial measures reflect industry conventions, or standard measures of liquidity, profitability or performance commonly used by the investment community for comparability purposes. These measurements should be considered in addition to, but not as a substitute for, financial information prepared in accordance with GAAP. We have defined below each of the non-GAAP measures we use, but these measures may not be synonymous to similar measurement terms used by other companies.
Sprint provides reconciliations of these non-GAAP measures in its financial reporting. Because Sprint does not predict special items that might occur in the future, and our forecasts are developed at a level of detail different than that used to prepare GAAP-based financial measures, Sprint does not provide reconciliations to GAAP of its forward-looking financial measures.
The measures used in this release include the following:
EBITDA is operating income/(loss) before depreciation and amortization. Adjusted EBITDA is EBITDA excluding severance, exit costs, and other special items. Adjusted EBITDA Margin represents Adjusted EBITDA divided by non-equipment net operating revenues for Wireless and Adjusted EBITDA divided by net operating revenues for Wireline. We believe that Adjusted EBITDA and Adjusted EBITDA Margin provide useful information to investors because they are an indicator of the strength and performance of our ongoing business operations. While depreciation and amortization are considered operating costs under GAAP, these expenses primarily represent non-cash current period costs associated with the use of long-lived tangible and definite-lived intangible assets. Adjusted EBITDA and Adjusted EBITDA Margin are calculations commonly used as a basis for investors, analysts and credit rating agencies to evaluate and compare the periodic and future operating performance and value of companies within the telecommunications industry.
Sprint Platform Postpaid ABPA is average billings per account and calculated by dividing postpaid service revenue earned from postpaid customers plus installment plan billings and lease revenue by the sum of the monthly average number of postpaid accounts during the period. We believe that ABPA provides useful information to investors, analysts and our management to evaluate average Sprint platform postpaid customer billings per account as it approximates the expected cash collections, including installment plan billings and lease revenue, per postpaid account each month.
Sprint Platform Postpaid Phone ABPU is average billings per postpaid phone user and calculated by dividing service revenue earned from postpaid phone customers plus installment plan billings and lease revenue by the sum of the monthly average number of postpaid phone connections during the period. We believe that ABPU provides useful information to investors, analysts and our management to evaluate average Sprint platform postpaid phone customer billings as it approximates the expected cash collections, including installment plan billings and lease revenue, per postpaid phone user each month.
Free Cash Flow is the cash provided by operating activities less the cash used in investing activities other than short-term investments, including changes in restricted cash, if any, and excluding proceeds from the sale-leaseback of assets. We believe that Free Cash Flow provides useful information to investors, analysts and our management about the cash generated by our core operations after interest and dividends, if any, and our ability to fund scheduled debt maturities and other financing activities, including discretionary refinancing and retirement of debt and purchase or sale of investments.
Net Debt is consolidated debt, including current maturities, less cash and cash equivalents, short-term investments and, if any, restricted cash. We believe that Net Debt provides useful information to investors, analysts and credit rating agencies about the capacity of the company to reduce the debt load and improve its capital structure.
SAFE HARBOR
This release includes “forward-looking statements” within the meaning of the securities laws. The words “may,” “could,” “should,” “estimate,” “project,” “forecast,” “intend,” “expect,” “anticipate,” “believe,” “target,” “plan, “outlook,” “providing guidance,” and similar expressions are intended to identify information that is not historical in nature. All statements that address operating performance, events or developments that we expect or anticipate will occur in the future — including statements relating to our network, connections growth, and liquidity; and statements expressing general views about future operating results — are forward-looking statements. Forward-looking statements are estimates and projections reflecting management’s judgment based on currently available information and involve a number of risks and uncertainties that could cause actual results to differ materially from those suggested by the forward-looking statements. With respect to these forward-looking statements, management has made assumptions regarding, among other things, the development and deployment of new technologies and services; efficiencies and cost savings of new technologies and services; customer and network usage; connection growth and retention; service, speed, coverage and quality; availability of devices; availability of various financings, including any leasing transactions; the timing of various events and the economic environment. Sprint believes these forward-looking statements are reasonable; however, you should not place undue reliance on forward-looking statements, which are based on current expectations and speak only as of the date when made. Sprint undertakes no obligation to publicly update or revise any forward-looking statements, whether as a result of new information, future events or otherwise, except as required by law. In addition, forward-looking statements are subject to certain risks and uncertainties that could cause actual results to differ materially from our company's historical experience and our present expectations or projections. Factors that might cause such differences include, but are not limited to, those discussed in Sprint Corporation’s Annual Report on Form 10-K for the fiscal year ended March 31, 2015. You should understand that it is not possible to predict or identify all such factors. Consequently, you should not consider any such list to be a complete set of all potential risks or uncertainties.
About Sprint:
Sprint (NYSE: S) is a communications services company that creates more and better ways to connect its customers to the things they care about most. Sprint served more than 58.4 million connections as of December 31, 2015 and is widely recognized for developing, engineering and deploying innovative technologies, including the first wireless 4G service from a national carrier in the United States; leading no-contract brands including Virgin Mobile USA, Boost Mobile, and Assurance Wireless; instant national and international push-to-talk capabilities; and a global Tier 1 Internet backbone. Sprint has been named to the Dow Jones Sustainability Index (DJSI) North America for the past five years. You can learn more and visit Sprint at www.sprint.com or www.facebook.com/sprint and www.twitter.com/sprint.
i Rankings and underlying data metrics based on 125 RootMetrics Metro RootScore Reports from 2H 2014 and 2H 2015 for mobile performance as tested on best available plans and devices on four mobile networks across all available network types. 16 markets that measured the fastest median download speeds in 2H 2015: Austin, TX; Chattanooga, TN; Corpus Christi, TX; Dallas, TX; Denton, TX; Denver, CO; Houston, TX; Indianapolis, IN; Kansas City, MO; McAllen, TX; Ogden, UT; Phoenix, AZ; Spokane, WA; Toledo, OH; Wichita, KS; and Youngstown, OH . Your experiences may vary. The RootMetrics award is not an endorsement of Sprint. Visit www.rootmetrics.com for more details.
