")

MCLEAN, Va.--(BUSINESS WIRE)--Hilton Worldwide Holdings Inc. ("Hilton," or the "Company") (NYSE: HLT) today reported its third quarter 2016 results. Highlights include:
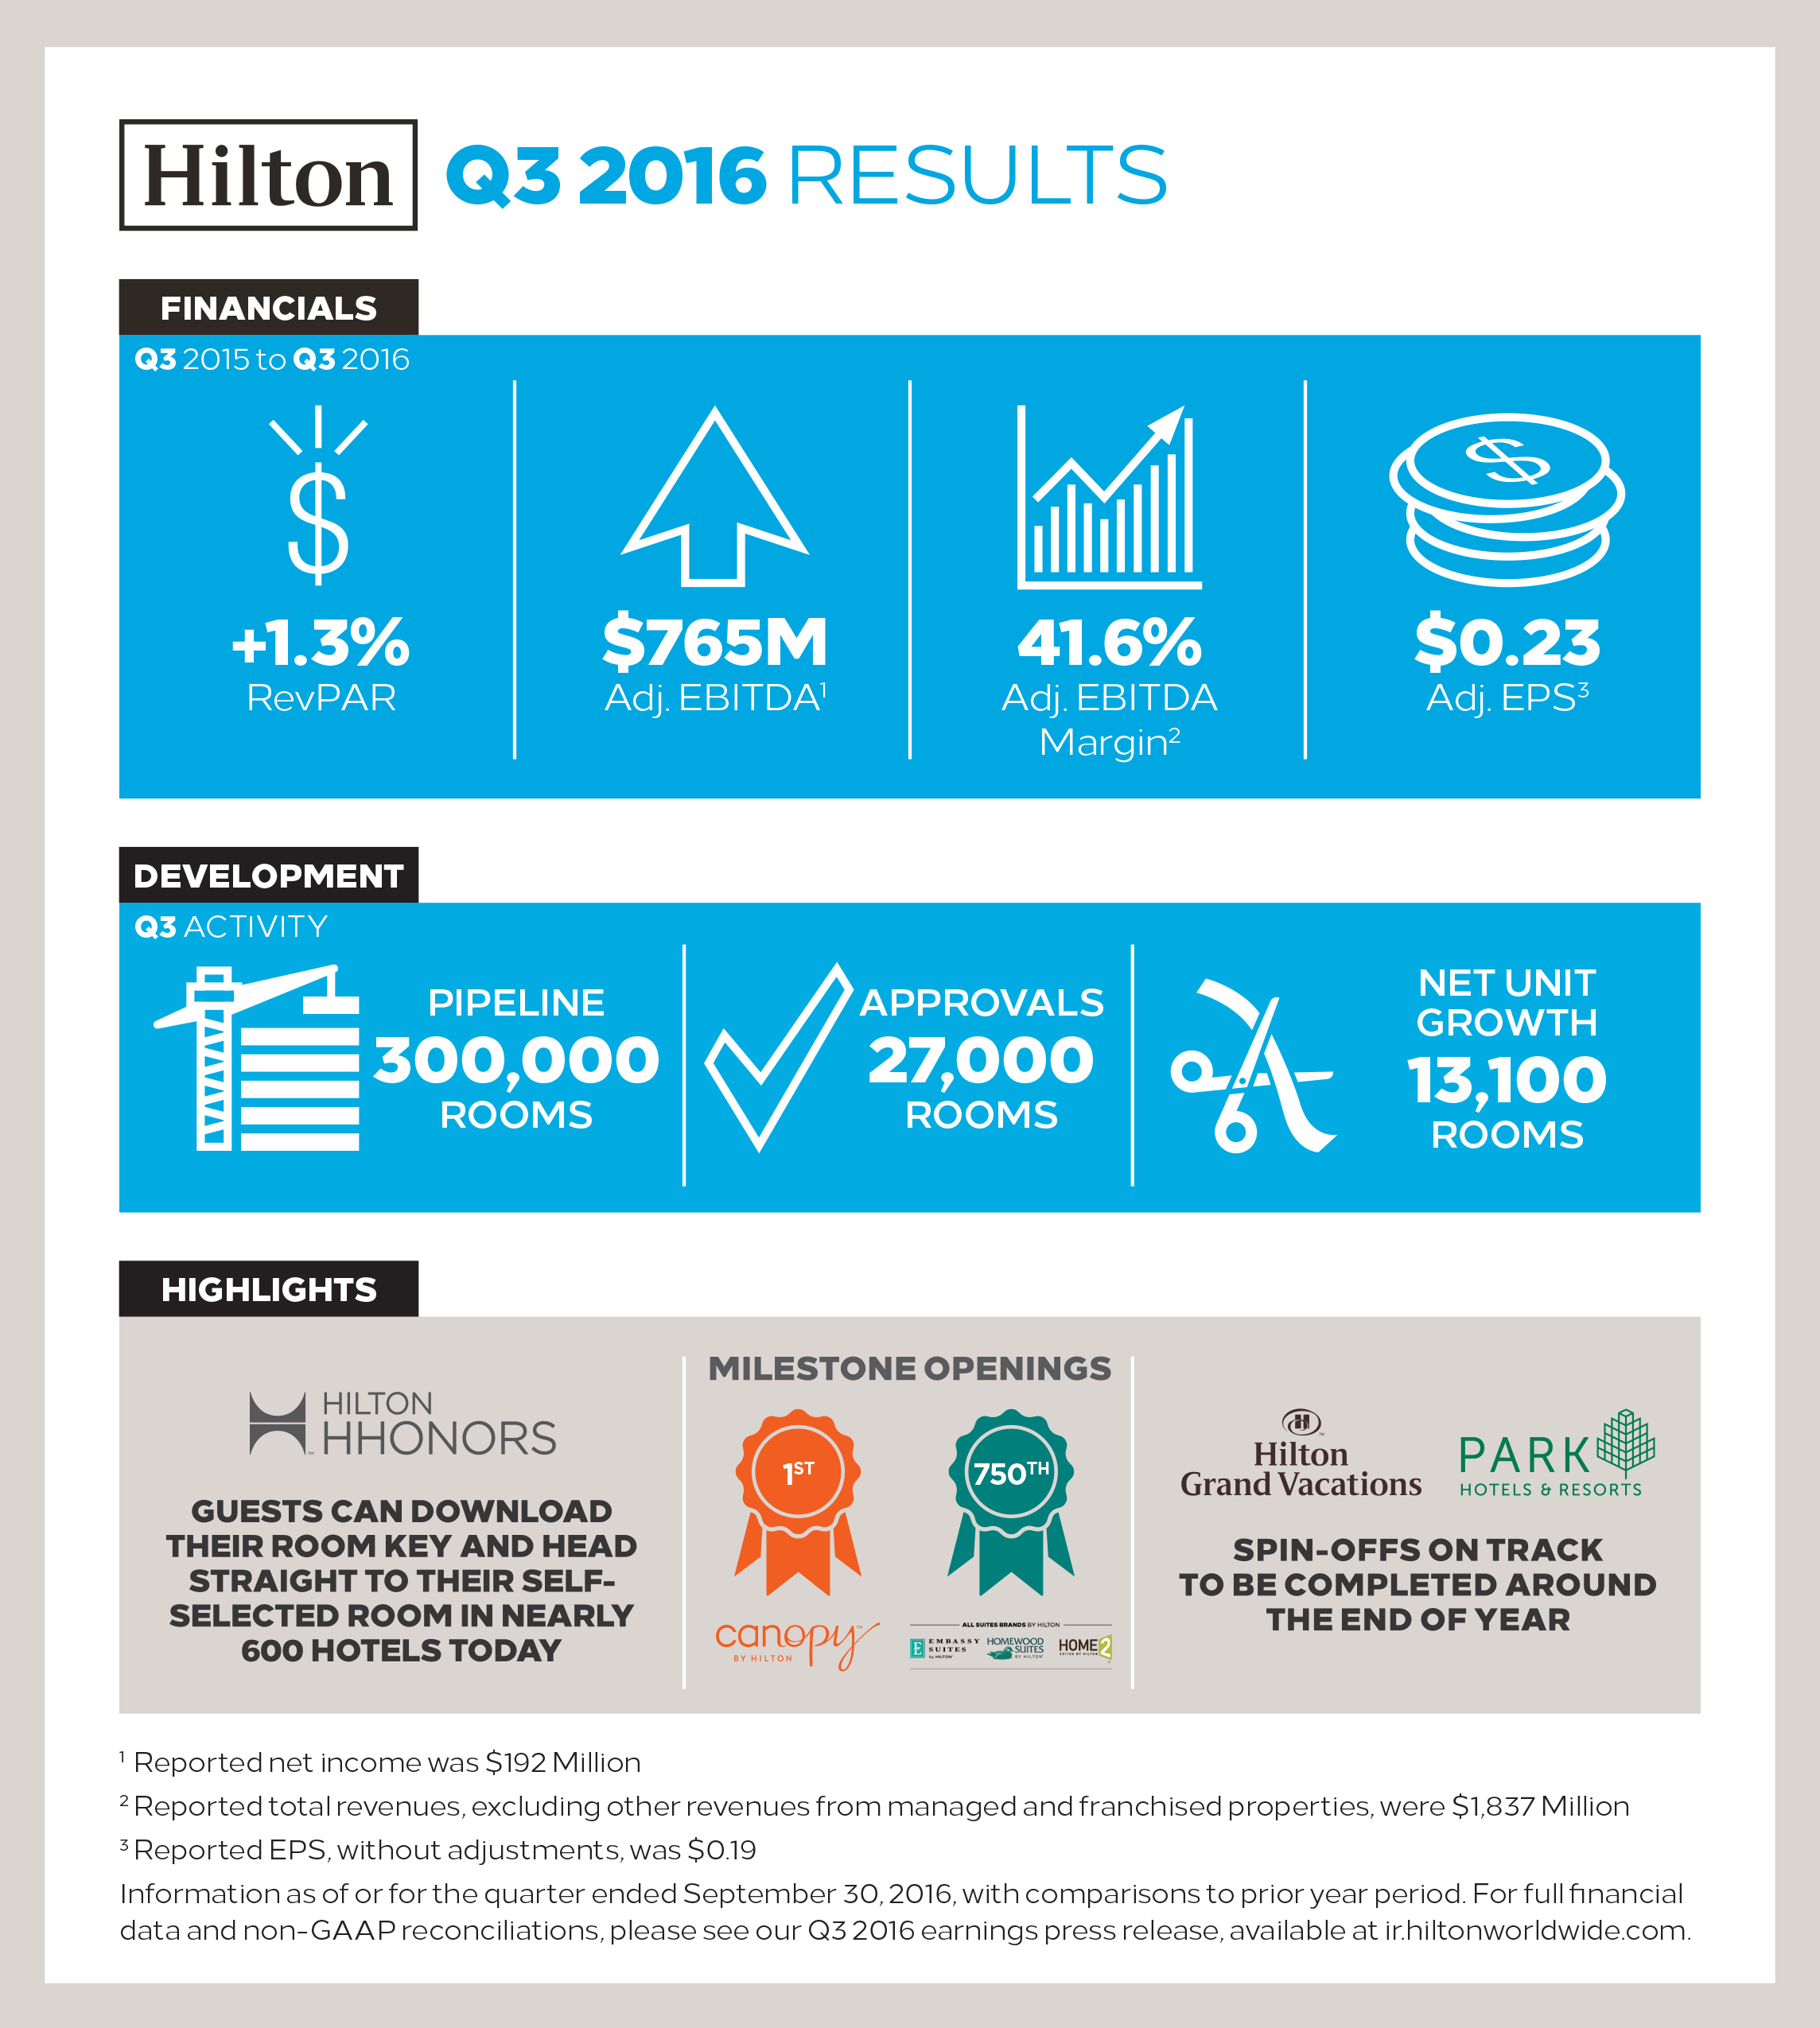
- EPS for the third quarter was $0.19 and EPS, adjusted for special items, was $0.23; net income for the third quarter was $192 million
- Adjusted EBITDA for the third quarter was $765 million and Adjusted EBITDA margin was 41.6 percent
- System-wide comparable RevPAR increased 1.3 percent for the third quarter on a currency neutral basis from the same period in 2015
- Management and franchise fees for the third quarter increased 7 percent from the same period in 2015 to $470 million
- Approved 27,000 new rooms for development during the third quarter, bringing year-to-date approvals to 77,000 rooms
- Grew development pipeline 15 percent from 2015 to 1,898 hotels, consisting of 300,000 rooms
- Net unit growth was 13,100 rooms in the third quarter, representing a 7 percent growth in managed and franchised rooms from 2015
- Opportunistically entered the capital markets to enhance Hilton's balance sheet by issuing $1 billion aggregate principal amount of 4.25% senior notes due 2024 and amending and extending $3,225 million of the Term Loans; repaid $991 million of long-term debt
- On track to complete the spin-off transactions of Park Hotels & Resorts and Hilton Grand Vacations around year end
- Hilton plans to host an investor day on December 8, 2016 at the Conrad New York
Overview
For the three months ended September 30, 2016, EPS was $0.19 compared to $0.28 for the three months ended September 30, 2015, and EPS, adjusted for special items, was $0.23 for both the three months ended September 30, 2016 and 2015. Net income was $192 million for the three months ended September 30, 2016 compared to $283 million for the three months ended September 30, 2015, and Adjusted EBITDA was $765 million for the three months ended September 30, 2016 compared to $758 million for the three months ended September 30, 2015.
For the nine months ended September 30, 2016, EPS was $0.74 compared to $0.60 for the nine months ended September 30, 2015, and EPS, adjusted for special items, was $0.66 for the nine months ended September 30, 2016 compared to $0.60 for the nine months ended September 30, 2015. Net income was $746 million for the nine months ended September 30, 2016 compared to $600 million for the nine months ended September 30, 2015, and Adjusted EBITDA was $2,224 million for the nine months ended September 30, 2016 compared to $2,134 million for the nine months ended September 30, 2015.
Christopher J. Nassetta, President & Chief Executive Officer of Hilton, said, "Even with a macroeconomic environment that continues to underperform expectations, we delivered Adjusted EBITDA and EPS, adjusted for special items, within our guidance ranges and continued to increase our global share of development activity this quarter. We approved deals for 27,000 new rooms in 22 different countries on 5 continents and opened over 14,300 rooms this quarter. Our accelerating, capital-light growth is driven by all of our clearly defined brands, with each of our brand segments at record pipelines. Our brands currently represent 22 percent of all rooms under construction globally, or nearly 5 times their current share of room supply."
Segment Highlights
Management and Franchise
Management and franchise fees were $470 million in the third quarter of 2016, an increase of 7 percent compared to the same period in 2015. RevPAR at comparable managed and franchised hotels in the third quarter of 2016 increased 1.5 percent on a currency neutral basis (a 0.9 percent increase in actual dollars) compared to the same period in 2015. The addition of new units, the increase in RevPAR at comparable managed and franchised hotels and rising effective franchise fee rates have yielded continued fee growth during the third quarter of 2016.
Ownership
Revenues from the ownership segment were $1,040 million in the third quarter of 2016 and ownership segment Adjusted EBITDA was $264 million. RevPAR at comparable hotels in the ownership segment was flat on a currency neutral basis (a 1.3 percent decrease in actual dollars) in the third quarter of 2016 compared to the same period in 2015. The lack of growth in ownership segment RevPAR in the third quarter of 2016 was primarily attributable to weaker performance in New York and Chicago, which was partially offset by relative strength at properties in Hawaii.
Timeshare
Timeshare segment revenues for the third quarter of 2016 were $358 million and timeshare Adjusted EBITDA was $85 million. Overall timeshare sales volume increased 15 percent in the third quarter of 2016, compared to the same period in 2015, as a result of increased tour flow and net volume per guest of 5 percent and 9 percent, respectively. Commissions from the sale of third-party developed timeshare intervals increased $11 million during the third quarter of 2016 from the same period in 2015, while sales revenue on owned inventory increased $6 million. Revenue from resort operations increased 12 percent during the third quarter of 2016 from the same period in 2015. These increases were offset by an increase in timeshare expenses due to higher selling and marketing expenses.
During the three months ended September 30, 2016, 63 percent of timeshare intervals sold were developed by third parties. Hilton's overall supply of timeshare intervals as of September 30, 2016 was approximately 127,000 intervals, or nearly six years of sales at current pace, of which 103,000, or 81 percent, were third-party developed.
Development
Hilton opened 106 hotels consisting of 14,300 rooms, of which over 20 percent were conversions from non-Hilton brands, and achieved net unit growth of 13,100 rooms during the third quarter of 2016. In July 2016, the first Canopy by Hilton opened in Reykjavik, Iceland. Additionally, Tru by Hilton had continued success in its initial year of development, with approvals for 51 hotels in the third quarter for a total of 144 hotels in the pipeline as of September 30, 2016.
As of September 30, 2016, Hilton's rooms pipeline totaled approximately 300,000 rooms at 1,898 hotels throughout 91 countries and territories, including 31 countries and territories where Hilton does not currently have any open hotels. Over 148,000 rooms, or approximately half of the pipeline, were located outside of the United States. Additionally, approximately 149,000 rooms were under construction. Including all agreements approved but not signed, Hilton's pipeline totaled nearly 310,000 rooms, which will be almost entirely funded by third-party owner investment.
Balance Sheet and Liquidity
During the third quarter of 2016, Hilton entered into the following financing transactions (the "Financing Transactions"):
- issued $1 billion aggregate principal amount of 4.25% senior notes due 2024 and used the net proceeds and available cash to repay $991 million of long-term debt;
- amended $3,225 million of its outstanding senior secured term loan facility (the "Term Loans") to remove the LIBOR floor, provide for a reduced interest rate spread and extend the maturity date by three years to 2023; and
- amended and extended its revolving non-recourse timeshare financing receivables credit facility to increase the maximum borrowings from $300 million to $450 million.
Additionally, during October 2016, Hilton made prepayments of $1,967 million on its existing commercial mortgage-backed securities ("CMBS") loan and issued two new CMBS loans, including a $725 million loan that matures in 2023 and is secured by two of its U.S. owned real estate assets and a $1,275 million loan that matures in 2026 and is secured by one of its U.S. owned real estate assets.
As of September 30, 2016, Hilton had $10.0 billion of long-term debt outstanding with a weighted average interest rate of 4.3 percent.
Total cash and cash equivalents were $1,131 million as of September 30, 2016, including $272 million of restricted cash and cash equivalents. No borrowings were outstanding under the $1.0 billion revolving credit facility as of September 30, 2016.
In September 2016, Hilton paid a quarterly cash dividend of $0.07 per share on shares of its common stock, for a total of $69 million, bringing total cash dividends paid in 2016 to $207 million. In October 2016, Hilton's board of directors authorized a regular quarterly cash dividend of $0.07 per share of common stock to be paid on or before December 2, 2016 to holders of record of its common stock as of the close of business on November 10, 2016.
In October 2016, Hilton announced that HNA Group agreed to acquire an approximate 25 percent equity interest in Hilton from affiliates of The Blackstone Group L.P., establishing a long-term strategic investment in Hilton and Hilton’s planned spin-offs of Park Hotels & Resorts Inc. ("Park") and Hilton Grand Vacations Inc. ("HGV"). The transaction is valued at approximately $6.5 billion, or $26.25 per share, and is expected to close in the first quarter of 2017, subject to regulatory approval.
Outlook
Hilton has disclosed financial and other details of the planned spin-offs of Park and HGV in filings with the Securities and Exchange Commission ("SEC"). The transactions are subject to execution of intercompany agreements, arrangement of adequate financing facilities, the effectiveness of the registration statements, final approval by Hilton's board of directors and other customary conditions. The spin-off transactions will not require a stockholder vote. The spin-offs are expected to be completed around year end, but there can be no assurance regarding the ultimate timing of the spin-offs or that either or both of the spin-offs will ultimately occur. The Full Year 2016, Fourth Quarter 2016 and Full Year 2017 outlooks do not include the effects of the spin-offs, including potential transaction costs.
Full Year 2016
- System-wide RevPAR is expected to increase between 1.5 percent and 2.0 percent on a comparable and currency neutral basis compared to 2015.
- Net income is projected to be between $948 million and $981 million.
- Adjusted EBITDA is projected to be between $2,960 million and $2,990 million.
- Management and franchise fees are projected to increase between 5 percent and 7 percent.
- Timeshare segment Adjusted EBITDA is projected to be between $370 million and $390 million.
- Corporate expense and other is projected to be between $240 million and $250 million.
- Diluted EPS, before special items, is projected to be between $0.94 and $0.97.
- Diluted EPS, adjusted for special items, is projected to be between $0.86 and $0.89.
- Capital expenditures, excluding timeshare inventory, are expected to be between $400 million and $450 million.
- Net unit growth is expected to be approximately 45,000 rooms to 50,000 rooms.
Fourth Quarter 2016
- System-wide RevPAR is expected to be flat to up 1.0 percent on a comparable and currency neutral basis compared to the fourth quarter of 2015.
- Net income is projected to be between $202 million and $235 million.
- Adjusted EBITDA is projected to be between $736 million and $766 million.
- Management and franchise fees are projected to increase between 2 percent and 4 percent.
- Diluted EPS, before special items, is projected to be between $0.20 and $0.23.
- Diluted EPS, adjusted for special items, is projected to be between $0.20 and $0.23.
Full Year 2017
For 2017, system-wide RevPAR is expected to increase between 1.0 percent and 3.0 percent on a comparable and currency neutral basis compared to 2016. Given Hilton's strong development pipeline, unit growth should continue to accelerate in 2017 as its global system of rooms is expected to expand by between 50,000 rooms and 55,000 rooms on a net basis.
Outlook for Post-Spin Companies
Upon the completion of the proposed spin-off transactions, Hilton will be separated into three independent, publicly traded companies: Hilton Worldwide Holdings Inc., Park Hotels & Resorts Inc. and Hilton Grand Vacations Inc. Full year 2016 outlook on a pro forma(1) basis for these companies is as follows:
- Hilton's pro forma Adjusted EBITDA is expected to be between $1,745 million and $1,775 million.
- Park's pro forma Adjusted EBITDA is expected to be between $750 million and $780 million.
- HGV's pro forma Adjusted EBITDA is expected to be between $370 million and $390 million.
| ____________ | ||
| (1) | Pro forma information gives effect to the spin-off transactions as if they occurred on January 1, 2016. Refer to the respective Form 10 Registration Statements of Park and HGV and the press release on these filings for additional information. | |
Investor Day
Hilton plans to host an investor day on Thursday, December 8, 2016 at the Conrad New York. More details will be available closer to the date at http://ir.hiltonworldwide.com.
Conference Call
Hilton will host a conference call to discuss third quarter 2016 results on October 26, 2016 at 10:00 a.m. Eastern Time. Participants may listen to the live webcast by logging onto the Hilton Investor Relations website at http://ir.hiltonworldwide.com/events-and-presentations. A replay and transcript of the webcast will be available within 24 hours after the live event at http://ir.hiltonworldwide.com/financial-reporting/quarterly-results/2016.
Alternatively, participants may listen to the live call by dialing 1-888-317-6003 in the United States or 1-412-317-6061 internationally. Please use the conference ID 2605045. Participants are encouraged to dial into the call or link to the webcast at least fifteen minutes prior to the scheduled start time. A telephone replay will be available for seven days following the call. To access the telephone replay, dial 1-877-344-7529 in the United States or 1-412-317-0088 internationally using the conference ID 10093919.
Forward-Looking Statements
This press release contains forward-looking statements within the meaning of Section 27A of the Securities Act of 1933, as amended, and Section 21E of the Securities Exchange Act of 1934, as amended. These statements include, but are not limited to, statements related to the expectations regarding the performance of Hilton's business, financial results, liquidity and capital resources, the planned spin-offs and other non-historical statements, including the statements in the "Outlook" section of this press release. You can identify these forward-looking statements by the use of words such as "outlook," "believes," "expects," "potential," "continues," "may," "will," "should," "could," "seeks," "approximately," "projects," "predicts," "intends," "plans," "estimates," "anticipates" or the negative version of these words or other comparable words. Such forward-looking statements are subject to various risks and uncertainties, including, among others, risks inherent to the hospitality industry, macroeconomic factors beyond Hilton's control, competition for hotel guests, management and franchise agreements and timeshare sales, risks related to doing business with third-party hotel owners, Hilton's significant investments in owned and leased real estate, performance of Hilton's information technology systems, growth of reservation channels outside of Hilton's system, risks of doing business outside of the United States, risks related to Hilton's proposed spin-offs and Hilton's indebtedness. Additional factors that could cause Hilton's results to differ materially from those described in the forward-looking statements can be found under the section entitled "Part I—Item 1A. Risk Factors" of the Annual Report on Form 10-K for the fiscal year ended December 31, 2015, filed with the SEC, as such factors may be updated from time to time in Hilton's periodic filings with the SEC, which are accessible on the SEC's website at www.sec.gov. Accordingly, there are or will be important factors that could cause actual outcomes or results to differ materially from those indicated in these statements. These factors should not be construed as exhaustive and should be read in conjunction with the other cautionary statements that are included in this release and in Hilton's filings with the SEC. The Company undertakes no obligation to publicly update or review any forward-looking statement, whether as a result of new information, future developments or otherwise, except as required by law.
Non-GAAP Financial Measures
The Company refers to certain non-GAAP financial measures in this press release, including net income and EPS, adjusted for special items, Adjusted EBITDA, Adjusted EBITDA margin, Net debt and Net debt to Adjusted EBITDA ratio. Please see the schedules to this press release including the "Definitions" section for additional information and reconciliations of such non-GAAP financial measures.
In addition, this press release includes projected pro forma Adjusted EBITDA for the year ending December 31, 2016 for each of Hilton, Park and HGV. A reconciliation of projected pro forma Adjusted EBITDA to a measure calculated in accordance with GAAP is not available without unreasonable effort due to the unavailability of certain information needed to calculate certain reconciling items, including interest expense and income tax expense. For the same reasons, we are unable to address the probable significance of the unavailable information, which could be material to future results.
About Hilton
Hilton (NYSE: HLT) is a leading global hospitality company, comprising more than 4,800 managed, franchised, owned and leased hotels and timeshare properties with nearly 789,000 rooms in 104 countries and territories. For 97 years, Hilton has been dedicated to continuing its tradition of providing exceptional guest experiences. The Company's portfolio of 13 world-class global brands includes Hilton Hotels & Resorts, Waldorf Astoria Hotels & Resorts, Conrad Hotels & Resorts, Canopy by Hilton, Curio - A Collection by Hilton, DoubleTree by Hilton, Embassy Suites by Hilton, Hilton Garden Inn, Hampton by Hilton, Tru by Hilton, Homewood Suites by Hilton, Home2 Suites by Hilton and Hilton Grand Vacations. The Company also manages an award-winning customer loyalty program, Hilton HHonors®. Hilton HHonors members who book directly through preferred Hilton channels have access to benefits including an exclusive member discount and free standard Wi-Fi, as well as digital amenities that are available exclusively through the industry-leading Hilton HHonors app, where Hilton HHonors members can check-in, choose their room and access their room using a Digital Key. Visit news.hiltonworldwide.com for more information and connect with Hilton at facebook.com/hiltonworldwide, twitter.com/hiltonworldwide, youtube.com/hiltonworldwide, flickr.com/hiltonworldwide, linkedin.com/company/hilton-worldwide and instagram.com/hiltonworldwide.
| HILTON WORLDWIDE HOLDINGS INC. |
| EARNINGS RELEASE SCHEDULES |
| TABLE OF CONTENTS |
|
|
|
Condensed Consolidated Statements of Operations |
|
Segment Adjusted EBITDA |
|
Comparable and Currency Neutral System-Wide Hotel Operating Statistics |
|
Management and Franchise Fees and Other Revenues |
|
Timeshare Revenues and Operating Expenses |
|
Hotel and Timeshare Property Summary |
|
Capital Expenditures |
|
Non-GAAP Financial Measures Reconciliations |
|
Definitions |
| HILTON WORLDWIDE HOLDINGS INC. | ||||||||||||||||
| CONDENSED CONSOLIDATED STATEMENTS OF OPERATIONS | ||||||||||||||||
| (unaudited, in millions, except per share data) | ||||||||||||||||
| Three Months Ended | Nine Months Ended | |||||||||||||||
| September 30, | September 30, | |||||||||||||||
| 2016 | 2015 | 2016 | 2015 | |||||||||||||
| Revenues | ||||||||||||||||
| Owned and leased hotels | $ | 1,033 | $ | 1,082 | $ | 3,105 | $ | 3,174 | ||||||||
| Management and franchise fees and other | 446 | 416 | 1,276 | 1,194 | ||||||||||||
| Timeshare | 358 | 334 | 1,020 | 974 | ||||||||||||
| 1,837 | 1,832 | 5,401 | 5,342 | |||||||||||||
| Other revenues from managed and franchised properties | 1,105 | 1,063 | 3,342 | 3,074 | ||||||||||||
| Total revenues | 2,942 | 2,895 | 8,743 | 8,416 | ||||||||||||
| Expenses | ||||||||||||||||
| Owned and leased hotels | 771 | 798 | 2,335 | 2,383 | ||||||||||||
| Timeshare | 257 | 219 | 697 | 673 | ||||||||||||
| Depreciation and amortization | 169 | 171 | 509 | 519 | ||||||||||||
| Impairment loss | — | — | 15 | — | ||||||||||||
| General, administrative and other | 147 | 145 | 392 | 493 | ||||||||||||
| 1,344 | 1,333 | 3,948 | 4,068 | |||||||||||||
| Other expenses from managed and franchised properties | 1,105 | 1,063 | 3,342 | 3,074 | ||||||||||||
| Total expenses | 2,449 | 2,396 | 7,290 | 7,142 | ||||||||||||
| Gain on sales of assets, net | — | 164 | 2 | 306 | ||||||||||||
| Operating income | 493 | 663 | 1,455 | 1,580 | ||||||||||||
| Interest income | 3 | 3 | 10 | 11 | ||||||||||||
| Interest expense | (148 | ) | (138 | ) | (434 | ) | (431 | ) | ||||||||
| Equity in earnings from unconsolidated affiliates | 7 | 9 | 18 | 22 | ||||||||||||
| Loss on foreign currency transactions | (8 | ) | (8 | ) | (33 | ) | (21 | ) | ||||||||
| Other gain (loss), net | (10 | ) | 1 | (15 | ) | (6 | ) | |||||||||
| Income before income taxes | 337 | 530 | 1,001 | 1,155 | ||||||||||||
| Income tax expense | (145 | ) | (247 | ) | (255 | ) | (555 | ) | ||||||||
| Net income | 192 | 283 | 746 | 600 | ||||||||||||
| Net income attributable to noncontrolling interests | (5 | ) | (4 | ) | (11 | ) | (10 | ) | ||||||||
| Net income attributable to Hilton stockholders | $ | 187 | $ | 279 | $ | 735 | $ | 590 | ||||||||
| Weighted average shares outstanding | ||||||||||||||||
| Basic | 988 | 987 | 988 | 986 | ||||||||||||
| Diluted | 992 | 989 | 991 | 989 | ||||||||||||
| Earnings per share | ||||||||||||||||
| Basic | $ | 0.19 | $ | 0.28 | $ | 0.74 | $ | 0.60 | ||||||||
| Diluted | $ | 0.19 | $ | 0.28 | $ | 0.74 | $ | 0.60 | ||||||||
| Cash dividends declared per share | $ | 0.07 | $ | 0.07 | $ | 0.21 | $ | 0.07 | ||||||||
| HILTON WORLDWIDE HOLDINGS INC. | ||||||||||||||||
| SEGMENT ADJUSTED EBITDA | ||||||||||||||||
| (unaudited, in millions) | ||||||||||||||||
| Three Months Ended | Nine Months Ended | |||||||||||||||
| September 30, | September 30, | |||||||||||||||
| 2016 | 2015 | 2016 | 2015 | |||||||||||||
| Management and franchise | $ | 470 | $ | 438 | $ | 1,350 | $ | 1,263 | ||||||||
| Ownership(1) | 264 | 281 | 770 | 789 | ||||||||||||
| Timeshare | 85 | 99 | 278 | 259 | ||||||||||||
| Corporate and other | (54 | ) | (60 | ) | (174 | ) | (177 | ) | ||||||||
| Adjusted EBITDA(2)(3) | $ | 765 | $ | 758 | $ | 2,224 | $ | 2,134 | ||||||||
| ____________ | ||
| (1) |
Includes unconsolidated affiliate Adjusted EBITDA. |
|
| (2) |
See "Non-GAAP Financial Measures Reconciliations—Adjusted EBITDA and Adjusted EBITDA Margin" for a reconciliation of net income to Adjusted EBITDA. |
|
| (3) |
Adjusted EBITDA includes the following intercompany charges that were eliminated in the unaudited condensed consolidated financial statements: |
|
|
Three Months Ended |
Nine Months Ended |
|||||||||||||||||
|
September 30, |
September 30, |
|||||||||||||||||
|
2016 |
2015 |
2016 |
2015 |
|||||||||||||||
|
Rental and other fees(a) |
$ |
6 |
$ |
6 |
$ |
19 |
$ |
17 |
||||||||||
|
Management, royalty and intellectual property fees(b) |
33 |
33 |
104 |
99 |
||||||||||||||
|
Licensing fee(c) |
12 |
11 |
33 |
31 |
||||||||||||||
|
Laundry services(d) |
3 |
3 |
6 |
6 |
||||||||||||||
|
Other(e) |
1 |
1 |
4 |
3 |
||||||||||||||
|
Intersegment fees elimination |
$ |
55 |
$ |
54 |
$ |
166 |
$ |
156 |
||||||||||
| ____________ | |||||
| (a) |
Represents fees charged to the timeshare segment by the ownership segment. |
||||
| (b) |
Represents fees charged to the ownership segment by the management and franchise segment. |
||||
| (c) |
Represents fees charged to the timeshare segment by the management and franchise segment. |
||||
| (d) |
Represents charges to the ownership segment for services provided by Hilton's wholly owned laundry business. Revenues from the laundry business are included in corporate and other. |
||||
| (e) |
Represents other intercompany charges, which are a benefit to the ownership segment and a cost to corporate and other. |
||||
| HILTON WORLDWIDE HOLDINGS INC. | |||||||||||||||||||||
| COMPARABLE AND CURRENCY NEUTRAL SYSTEM-WIDE HOTEL OPERATING STATISTICS | |||||||||||||||||||||
| BY REGION | |||||||||||||||||||||
| (unaudited) | |||||||||||||||||||||
| Three Months Ended September 30, | |||||||||||||||||||||
| Occupancy | ADR | RevPAR | |||||||||||||||||||
| 2016 | vs. 2015 | 2016 | vs. 2015 | 2016 | vs. 2015 | ||||||||||||||||
| Americas | 80.3 | % | (0.3 | )% |
pts. |
$ | 144.56 | 2.1 | % | $ | 116.03 | 1.7 | % | ||||||||
| Europe | 79.6 | (1.7 | ) | 148.66 | 1.5 | 118.36 | (0.7 | ) | |||||||||||||
| Middle East & Africa | 65.9 | (0.7 | ) | 164.54 | (1.6 | ) | 108.37 | (2.6 | ) | ||||||||||||
| Asia Pacific | 74.4 | 3.8 | 144.87 | (4.5 | ) | 107.78 | 0.6 | ||||||||||||||
| System-wide | 79.5 | (0.2 | ) | 145.43 | 1.5 | 115.54 | 1.3 | ||||||||||||||
| Nine Months Ended September 30, | |||||||||||||||||||||
| Occupancy | ADR | RevPAR | |||||||||||||||||||
| 2016 | vs. 2015 | 2016 | vs. 2015 | 2016 | vs. 2015 | ||||||||||||||||
| Americas | 77.4 | % | (0.1 | )% |
pts. |
$ | 143.41 | 2.3 | % | $ | 111.02 | 2.2 | % | ||||||||
| Europe | 73.7 | (1.3 | ) | 148.38 | 2.7 | 109.29 | 0.9 | ||||||||||||||
| Middle East & Africa | 63.3 | (3.5 | ) | 168.94 | 5.3 | 106.99 | (0.2 | ) | |||||||||||||
| Asia Pacific | 70.7 | 3.9 | 145.33 | (1.6 | ) | 102.74 | 4.1 | ||||||||||||||
| System-wide | 76.3 | (0.1 | ) | 144.56 | 2.2 | 110.28 | 2.1 | ||||||||||||||
| HILTON WORLDWIDE HOLDINGS INC. | |||||||||||||||||||||
| COMPARABLE AND CURRENCY NEUTRAL SYSTEM-WIDE HOTEL OPERATING STATISTICS | |||||||||||||||||||||
| BY BRAND | |||||||||||||||||||||
| (unaudited) | |||||||||||||||||||||
| Three Months Ended September 30, | |||||||||||||||||||||
| Occupancy | ADR | RevPAR | |||||||||||||||||||
| 2016 | vs. 2015 | 2016 | vs. 2015 | 2016 | vs. 2015 | ||||||||||||||||
| Waldorf Astoria Hotels & Resorts | 63.4 | % | 1.3 | % |
pts. |
$ | 267.69 | 10.7 | % | $ | 169.74 | 13.0 | % | ||||||||
| Conrad Hotels & Resorts | 74.6 | 4.2 | 234.70 | (7.0 | ) | 174.97 | (1.4 | ) | |||||||||||||
| Hilton Hotels & Resorts | 78.8 | (0.1 | ) | 167.95 | 0.9 | 132.32 | 0.8 | ||||||||||||||
| Curio - A Collection by Hilton | 82.0 | 1.9 | 177.85 | 0.7 | 145.78 | 3.1 | |||||||||||||||
| DoubleTree by Hilton | 78.2 | (0.1 | ) | 138.00 | 2.4 | 107.94 | 2.3 | ||||||||||||||
| Embassy Suites by Hilton | 82.2 | (0.1 | ) | 163.08 | 2.3 | 134.09 | 2.2 | ||||||||||||||
| Hilton Garden Inn | 79.8 | (0.4 | ) | 136.25 | 1.3 | 108.74 | 0.8 | ||||||||||||||
| Hampton by Hilton | 79.6 | (0.6 | ) | 124.88 | 1.6 | 99.43 | 0.9 | ||||||||||||||
| Homewood Suites by Hilton | 83.4 | (0.3 | ) | 136.44 | 1.3 | 113.80 | 1.0 | ||||||||||||||
| Home2 Suites by Hilton | 83.9 | 3.5 | 119.18 | 2.1 | 100.01 | 6.5 | |||||||||||||||
| System-wide | 79.5 | (0.2 | ) | 145.43 | 1.5 | 115.54 | 1.3 | ||||||||||||||
| Nine Months Ended September 30, | |||||||||||||||||||||
| Occupancy | ADR | RevPAR | |||||||||||||||||||
| 2016 | vs. 2015 | 2016 | vs. 2015 | 2016 | vs. 2015 | ||||||||||||||||
| Waldorf Astoria Hotels & Resorts | 65.7 | % | — | % |
pts. |
$ | 302.20 | 7.3 | % | $ | 198.42 | 7.3 | % | ||||||||
| Conrad Hotels & Resorts | 69.8 | 1.5 | 250.19 | (3.5 | ) | 174.63 | (1.3 | ) | |||||||||||||
| Hilton Hotels & Resorts | 75.3 | (0.5 | ) | 168.09 | 2.6 | 126.63 | 1.9 | ||||||||||||||
| Curio - A Collection by Hilton | 74.0 | (0.2 | ) | 185.04 | 5.0 | 136.97 | 4.7 | ||||||||||||||
| DoubleTree by Hilton | 75.5 | 0.6 | 136.91 | 2.7 | 103.40 | 3.4 | |||||||||||||||
| Embassy Suites by Hilton | 80.7 | 0.4 | 162.86 | 2.7 | 131.50 | 3.3 | |||||||||||||||
| Hilton Garden Inn | 77.1 | (0.1 | ) | 133.81 | 1.9 | 103.16 | 1.7 | ||||||||||||||
| Hampton by Hilton | 75.7 | (0.2 | ) | 121.95 | 1.7 | 92.34 | 1.4 | ||||||||||||||
| Homewood Suites by Hilton | 80.5 | (0.2 | ) | 135.55 | 1.9 | 109.09 | 1.7 | ||||||||||||||
| Home2 Suites by Hilton | 80.8 | 3.8 | 117.08 | 1.7 | 94.60 | 6.7 | |||||||||||||||
| System-wide | 76.3 | (0.1 | ) | 144.56 | 2.2 | 110.28 | 2.1 | ||||||||||||||
| HILTON WORLDWIDE HOLDINGS INC. | ||||||||||||||||||||||
| COMPARABLE AND CURRENCY NEUTRAL SYSTEM-WIDE HOTEL OPERATING STATISTICS | ||||||||||||||||||||||
| BY SEGMENT | ||||||||||||||||||||||
| (unaudited) | ||||||||||||||||||||||
| Three Months Ended September 30, | ||||||||||||||||||||||
| Occupancy | ADR | RevPAR | ||||||||||||||||||||
| 2016 | vs. 2015 | 2016 | vs. 2015 | 2016 | vs. 2015 | |||||||||||||||||
| Ownership(1) | 83.0 | % | (0.4 | )% | pts. | $ | 187.50 | 0.5 | % | $ | 155.59 | — | % | |||||||||
| U.S. | 84.6 | (0.6 | ) | 202.21 | 2.5 | 171.11 | 1.8 | |||||||||||||||
| International (non-U.S.) | 81.1 | (0.2 | ) | 169.91 | (2.3 | ) | 137.80 | (2.5 | ) | |||||||||||||
| Management and franchise | 79.1 | (0.2 | ) | 141.27 | 1.7 | 111.77 | 1.5 | |||||||||||||||
| U.S. | 80.1 | (0.3 | ) | 141.93 | 1.9 | 113.71 | 1.4 | |||||||||||||||
| International (non-U.S.) | 75.1 | 0.4 | 138.43 | 1.0 | 103.94 | 1.5 | ||||||||||||||||
| System-wide | 79.5 | (0.2 | ) | 145.43 | 1.5 | 115.54 | 1.3 | |||||||||||||||
| U.S. | 80.4 | (0.3 | ) | 145.68 | 1.9 | 117.10 | 1.5 | |||||||||||||||
| International (non-U.S.) | 76.2 | 0.3 | 144.49 | 0.2 | 110.06 | 0.6 | ||||||||||||||||
| Nine Months Ended September 30, | ||||||||||||||||||||||
| Occupancy | ADR | RevPAR | ||||||||||||||||||||
| 2016 | vs. 2015 | 2016 | vs. 2015 | 2016 | vs. 2015 | |||||||||||||||||
| Ownership(1) | 79.4 | % | (0.8 | )% | pts. | $ | 187.69 | 2.2 | % | $ | 148.94 | 1.1 | % | |||||||||
| U.S. | 82.8 | (0.7 | ) | 200.98 | 2.9 | 166.46 | 2.0 | |||||||||||||||
| International (non-U.S.) | 75.4 | (1.0 | ) | 170.94 | 1.0 | 128.85 | (0.2 | ) | ||||||||||||||
| Management and franchise | 76.0 | — | 140.31 | 2.3 | 106.63 | 2.2 | ||||||||||||||||
| U.S. | 77.3 | (0.1 | ) | 140.80 | 2.2 | 108.87 | 2.1 | |||||||||||||||
| International (non-U.S.) | 70.6 | 0.2 | 138.18 | 2.6 | 97.59 | 3.0 | ||||||||||||||||
| System-wide | 76.3 | (0.1 | ) | 144.56 | 2.2 | 110.28 | 2.1 | |||||||||||||||
| U.S. | 77.7 | (0.1 | ) | 144.59 | 2.2 | 112.28 | 2.1 | |||||||||||||||
| International (non-U.S.) | 71.5 | — | 144.43 | 2.2 | 103.25 | 2.2 | ||||||||||||||||
| ____________ | ||
| (1) |
Includes owned and leased hotels, as well as hotels owned or leased by entities in which Hilton owns a noncontrolling interest. |
|
| HILTON WORLDWIDE HOLDINGS INC. | ||||||||||||||
| MANAGEMENT AND FRANCHISE FEES AND OTHER REVENUES | ||||||||||||||
| (unaudited, dollars in millions) | ||||||||||||||
| Three Months Ended | ||||||||||||||
| September 30, | Increase / (Decrease) | |||||||||||||
| 2016 | 2015 | $ | % | |||||||||||
| Management fees: | ||||||||||||||
| Base fees(1) | $ | 87 | $ | 87 | — | — | ||||||||
| Incentive fees(2) | 37 | 34 | 3 | 8.8 | ||||||||||
| Total base and incentive fees | 124 | 121 | 3 | 2.5 | ||||||||||
| Other management fees(3) | 10 | 7 | 3 | 42.9 | ||||||||||
| Total management fees | 134 | 128 | 6 | 4.7 | ||||||||||
| Franchise fees(4) | 336 | 310 | 26 | 8.4 | ||||||||||
| Total management and franchise fees | 470 | 438 | 32 | 7.3 | ||||||||||
| Other revenues(5) | 24 | 25 | (1 | ) | (4.0 | ) | ||||||||
| Intersegment fees elimination(1)(2)(4)(5) | (48 | ) | (47 | ) | (1 | ) | 2.1 | |||||||
| Management and franchise fees and other revenues | $ | 446 | $ | 416 | 30 | 7.2 | ||||||||
| Nine Months Ended | ||||||||||||||
| September 30, | Increase / (Decrease) | |||||||||||||
| 2016 | 2015 | $ | % | |||||||||||
| Management fees: | ||||||||||||||
| Base fees(1) | $ | 265 | $ | 257 | 8 | 3.1 | ||||||||
| Incentive fees(2) | 115 | 107 | 8 | 7.5 | ||||||||||
| Total base and incentive fees | 380 | 364 | 16 | 4.4 | ||||||||||
| Other management fees(3) | 29 | 24 | 5 | 20.8 | ||||||||||
| Total management fees | 409 | 388 | 21 | 5.4 | ||||||||||
| Franchise fees(4) | 941 | 875 | 66 | 7.5 | ||||||||||
| Total management and franchise fees | 1,350 | 1,263 | 87 | 6.9 | ||||||||||
| Other revenues(5) | 69 | 67 | 2 | 3.0 | ||||||||||
| Intersegment fees elimination(1)(2)(4)(5) | (143 | ) | (136 | ) | (7 | ) | 5.1 | |||||||
| Management and franchise fees and other revenues | $ | 1,276 | $ | 1,194 | 82 | 6.9 | ||||||||
| ____________ | ||
| (1) |
Includes fees charged to consolidated owned and leased properties of $30 million and $32 million for the three months ended September 30, 2016 and 2015, respectively, and $92 million and $90 million for the nine months ended September 30, 2016 and 2015, respectively. |
|
| (2) |
Includes fees charged to consolidated owned and leased properties of $3 million and $1 million for the three months ended September 30, 2016 and 2015, respectively, and $12 million and $9 million for the nine months ended September 30, 2016 and 2015, respectively. |
|
| (3) |
Includes timeshare homeowners' association, early termination, product improvement plan and other fees. |
|
| (4) |
Includes a licensing fee charged to the timeshare segment of $12 million and $11 million for the three months ended September 30, 2016 and 2015, respectively, and $33 million and $31 million for the nine months ended September 30, 2016 and 2015, respectively. |
|
| (5) |
Includes charges to consolidated owned and leased properties for services provided by Hilton's wholly owned laundry business of $3 million for each of the three months ended September 30, 2016 and 2015 and $6 million for each of the nine months ended September 30, 2016 and 2015. |
|
|
HILTON WORLDWIDE HOLDINGS INC. |
||||||||||||||||
|
TIMESHARE REVENUES AND OPERATING EXPENSES |
||||||||||||||||
|
(unaudited, dollars in millions) |
||||||||||||||||
| Three Months Ended | ||||||||||||||||
| September 30, | Increase / (Decrease) | |||||||||||||||
|
|
2016 | 2015 | $ | % | ||||||||||||
| Revenues |
|
|||||||||||||||
| Timeshare sales | $ | 263 | $ | 246 | 17 | 6.9 | ||||||||||
| Resort operations | 57 | 51 | 6 | 11.8 | ||||||||||||
|
Financing and other |
38 | 37 | 1 | 2.7 | ||||||||||||
| $ | 358 | $ | 334 | 24 | 7.2 | |||||||||||
| Operating Expenses | ||||||||||||||||
| Timeshare sales | $ | 204 | $ | 172 | 32 | 18.6 | ||||||||||
| Resort operations | 34 | 31 | 3 | 9.7 | ||||||||||||
| Financing and other | 19 | 16 | 3 | 18.8 | ||||||||||||
| $ | 257 | $ | 219 | 38 | 17.4 | |||||||||||
| Nine Months Ended | ||||||||||||||||
| September 30, | Increase / (Decrease) | |||||||||||||||
| 2016 | 2015 | $ | % | |||||||||||||
| Revenues | ||||||||||||||||
| Timeshare sales | $ | 737 | $ | 716 | 21 | 2.9 | ||||||||||
| Resort operations | 172 | 152 | 20 | 13.2 | ||||||||||||
| Financing and other | 111 | 106 | 5 | 4.7 | ||||||||||||
| $ | 1,020 | $ | 974 | 46 | 4.7 | |||||||||||
| Operating Expenses | ||||||||||||||||
| Timeshare sales | $ | 544 | $ | 532 | 12 | 2.3 | ||||||||||
| Resort operations | 98 | 94 | 4 | 4.3 | ||||||||||||
| Financing and other | 55 | 47 | 8 | 17.0 | ||||||||||||
| $ | 697 | $ | 673 | 24 | 3.6 | |||||||||||
|
HILTON WORLDWIDE HOLDINGS INC. |
||||||||||||||||
|
HOTEL AND TIMESHARE PROPERTY SUMMARY |
||||||||||||||||
|
As of September 30, 2016 |
||||||||||||||||
| Owned / Leased(1) | Managed | Franchised | Total | |||||||||||||
| Properties | Rooms | Properties | Rooms | Properties | Rooms | Properties | Rooms | |||||||||
| Waldorf Astoria Hotels & Resorts | ||||||||||||||||
| U.S. | 4 | 1,174 | 9 | 5,409 | — | — | 13 | 6,583 | ||||||||
| Americas (excluding U.S.) | — | — | 1 | 144 | 1 | 984 | 2 | 1,128 | ||||||||
| Europe | 2 | 463 | 4 | 898 | — | — | 6 | 1,361 | ||||||||
| Middle East & Africa | — | — | 3 | 703 | — | — | 3 | 703 | ||||||||
| Asia Pacific | — | — | 2 | 431 | — | — | 2 | 431 | ||||||||
| Conrad Hotels & Resorts | ||||||||||||||||
| U.S. | — | — | 3 | 1,029 | — | — | 3 | 1,029 | ||||||||
| Americas (excluding U.S.) | — | — | — | — | 1 | 294 | 1 | 294 | ||||||||
| Europe | 1 | 191 | 2 | 707 | 1 | 256 | 4 | 1,154 | ||||||||
| Middle East & Africa | 1 | 614 | 3 | 1,079 | — | — | 4 | 1,693 | ||||||||
| Asia Pacific | — | — | 14 | 4,315 | 2 | 776 | 16 | 5,091 | ||||||||
| Canopy by Hilton | ||||||||||||||||
| Europe | — | — | — | — | 1 | 112 | 1 | 112 | ||||||||
| Hilton Hotels & Resorts | ||||||||||||||||
| U.S. | 25 | 23,087 | 38 | 24,094 | 177 | 53,647 | 240 | 100,828 | ||||||||
| Americas (excluding U.S.) | 3 | 1,668 | 22 | 7,428 | 18 | 5,810 | 43 | 14,906 | ||||||||
| Europe | 68 | 17,691 | 44 | 14,910 | 40 | 9,822 | 152 | 42,423 | ||||||||
| Middle East & Africa | 6 | 2,279 | 45 | 13,966 | 1 | 410 | 52 | 16,655 | ||||||||
| Asia Pacific | 7 | 3,391 | 72 | 27,176 | 7 | 2,826 | 86 | 33,393 | ||||||||
| Curio - A Collection by Hilton | ||||||||||||||||
| U.S. | 1 | 224 | 1 | 998 | 19 | 4,395 | 21 | 5,617 | ||||||||
| Americas (excluding U.S.) | — | — | — | — | 3 | 525 | 3 | 525 | ||||||||
| Europe | — | — | — | — | 2 | 311 | 2 | 311 | ||||||||
| DoubleTree by Hilton | ||||||||||||||||
| U.S. | 11 | 4,264 | 27 | 8,141 | 283 | 67,473 | 321 | 79,878 | ||||||||
| Americas (excluding U.S.) | — | — | 4 | 863 | 17 | 3,275 | 21 | 4,138 | ||||||||
| Europe | — | — | 12 | 3,649 | 63 | 10,964 | 75 | 14,613 | ||||||||
| Middle East & Africa | — | — | 9 | 2,114 | 4 | 488 | 13 | 2,602 | ||||||||
| Asia Pacific | — | — | 43 | 12,156 | 2 | 965 | 45 | 13,121 | ||||||||
| Embassy Suites by Hilton | ||||||||||||||||
| U.S. | 10 | 2,402 | 33 | 8,931 | 181 | 41,292 | 224 | 52,625 | ||||||||
| Americas (excluding U.S.) | — | — | 3 | 634 | 5 | 1,282 | 8 | 1,916 | ||||||||
| Hilton Garden Inn | ||||||||||||||||
| U.S. | 2 | 290 | 4 | 430 | 593 | 81,881 | 599 | 82,601 | ||||||||
| Americas (excluding U.S.) | — | — | 8 | 1,071 | 28 | 4,491 | 36 | 5,562 | ||||||||
| Europe | — | — | 18 | 3,306 | 32 | 5,275 | 50 | 8,581 | ||||||||
| Middle East & Africa | — | — | 6 | 1,337 | — | — | 6 | 1,337 | ||||||||
| Asia Pacific | — | — | 12 | 2,344 | — | — | 12 | 2,344 | ||||||||
| Hampton by Hilton | ||||||||||||||||
| U.S. | 1 | 130 | 49 | 6,070 | 1,980 | 192,360 | 2,030 | 198,560 | ||||||||
| Americas (excluding U.S.) | — | — | 11 | 1,416 | 85 | 10,055 | 96 | 11,471 | ||||||||
| Europe | — | — | 13 | 2,090 | 34 | 5,027 | 47 | 7,117 | ||||||||
| Asia Pacific | — | — | — | — | 7 | 1,277 | 7 | 1,277 | ||||||||
| Homewood Suites by Hilton | ||||||||||||||||
| U.S. | — | — | 25 | 2,687 | 367 | 41,401 | 392 | 44,088 | ||||||||
| Americas (excluding U.S.) | — | — | 3 | 321 | 15 | 1,699 | 18 | 2,020 | ||||||||
| Home2 Suites by Hilton | ||||||||||||||||
| U.S. | — | — | — | — | 112 | 11,572 | 112 | 11,572 | ||||||||
| Americas (excluding U.S.) | — | — | — | — | 3 | 317 | 3 | 317 | ||||||||
| Other | — | — | 2 | 888 | 3 | 407 | 5 | 1,295 | ||||||||
| Lodging | 142 | 57,868 | 545 | 161,735 | 4,087 | 561,669 | 4,774 | 781,272 | ||||||||
| Hilton Grand Vacations | — | — | 46 | 7,592 | — | — | 46 | 7,592 | ||||||||
| Total | 142 | 57,868 | 591 | 169,327 | 4,087 | 561,669 | 4,820 | 788,864 | ||||||||
| ____________ | ||
|
(1) |
Includes hotels owned or leased by entities in which Hilton owns a noncontrolling interest. |
|
|
HILTON WORLDWIDE HOLDINGS INC. |
|||||||||||||
|
CAPITAL EXPENDITURES |
|||||||||||||
|
(unaudited, dollars in millions) |
|||||||||||||
| Three Months Ended | |||||||||||||
| September 30, | Increase / (Decrease) | ||||||||||||
| 2016 | 2015 | $ | % | ||||||||||
| Hotel property and equipment | $ | 50 | $ | 52 | (2 | ) | (3.8 | ) | |||||
| Timeshare property and equipment | 4 | 2 | 2 | NM(1) | |||||||||
| Corporate and other property and equipment | 4 | 1 | 3 | NM(1) | |||||||||
| Total capital expenditures for property and equipment | 58 | 55 | 3 | 5.5 | |||||||||
| Capitalized software costs | 21 | 15 | 6 | 40.0 | |||||||||
| Contract acquisition costs | 17 | 8 | 9 | NM(1) | |||||||||
| Expenditures for timeshare inventory net of costs of sales(2) | (14 | ) | 6 | (20 | ) | NM(1) | |||||||
| Total capital expenditures | $ | 82 | $ | 84 | (2 | ) | (2.4 | ) | |||||
| Nine Months Ended | |||||||||||||
| September 30, | Increase / (Decrease) | ||||||||||||
| 2016 | 2015 | $ | % | ||||||||||
| Hotel property and equipment | $ | 203 | $ | 200 | 3 | 1.5 | |||||||
| Timeshare property and equipment | 15 | 7 | 8 | NM(1) | |||||||||
| Corporate and other property and equipment | 9 | 7 | 2 | 28.6 | |||||||||
| Total capital expenditures for property and equipment | 227 | 214 | 13 | 6.1 | |||||||||
| Capitalized software costs | 56 | 38 | 18 | 47.4 | |||||||||
| Contract acquisition costs | 35 | 27 | 8 | 29.6 | |||||||||
| Expenditures for timeshare inventory net of costs of sales(2) | (25 | ) | 20 | (45 | ) | NM(1) | |||||||
| Total capital expenditures | $ | 293 | $ | 299 | (6 | ) | (2.0 | ) | |||||
| ____________ | ||
| (1) | Fluctuation in terms of percentage change is not meaningful. | |
| (2) | Timeshare capital expenditures for inventory additions were $16 million and $34 million for the three months ended September 30, 2016 and 2015, respectively, and $50 million and $110 million for the nine months ended September 30, 2016 and 2015, respectively, and timeshare costs of sales were $30 million and $28 million for the three months ended September 30, 2016 and 2015, respectively, and $75 million and $90 million for the nine months ended September 30, 2016 and 2015, respectively. | |
|
HILTON WORLDWIDE HOLDINGS INC. |
||||||||||||||||
|
NON-GAAP FINANCIAL MEASURES RECONCILIATIONS |
||||||||||||||||
|
NET INCOME AND EPS, ADJUSTED FOR SPECIAL ITEMS |
||||||||||||||||
|
(unaudited, in millions, except per share data) |
||||||||||||||||
| Three Months Ended | Nine Months Ended | |||||||||||||||
| September 30, | September 30, | |||||||||||||||
| 2016 | 2015 | 2016 | 2015 | |||||||||||||
| Net income attributable to Hilton stockholders, as reported | $ | 187 | $ | 279 | $ | 735 | $ | 590 | ||||||||
| Diluted EPS, as reported | $ | 0.19 | $ | 0.28 | $ | 0.74 | $ | 0.60 | ||||||||
| Special items: | ||||||||||||||||
| Impairment loss | $ | — | $ | — | $ | 15 | $ | — | ||||||||
| Costs incurred for planned spin-offs(1) | 27 | — | 54 | — | ||||||||||||
| Share-based compensation expense(2) | — | — | — | 66 | ||||||||||||
| Asset acquisitions and dispositions(3) | 16 | (129 | ) | 18 | (172 | ) | ||||||||||
| Gain on capital lease amendment(4) | — | — | — | (24 | ) | |||||||||||
| Secondary offering expenses(5) | — | — | — | 2 | ||||||||||||
| Financing transactions(6) | 14 | — | 14 | — | ||||||||||||
| Tax-related adjustments(7) | — | — | (153 | ) | 4 | |||||||||||
| Total special items before tax | 57 | (129 | ) | (52 | ) | (124 | ) | |||||||||
| Income tax benefit (expense) on special items | (13 | ) | 80 | (30 | ) | 125 | ||||||||||
| Total special items after tax | $ | 44 | $ | (49 | ) | $ | (82 | ) | $ | 1 | ||||||
| Net income, adjusted for special items | $ | 231 | $ | 230 | $ | 653 | $ | 591 | ||||||||
| Diluted EPS, adjusted for special items | $ | 0.23 | $ | 0.23 | $ | 0.66 | $ | 0.60 | ||||||||
| ____________ | ||
| (1) | These amounts include expenses that were recognized in general, administrative and other expenses related to the planned spin-offs of Park and HGV. | |
| (2) | This amount includes expenses that were recognized in general, administrative and other expenses related to share-based compensation prior to and in connection with the initial public offering. This amount excludes share-based compensation expense related to awards issued under the Hilton Worldwide Holdings Inc. 2013 Omnibus Incentive Plan. | |
| (3) | The amounts for the three and nine months ended September 30, 2016 relate to severance costs from the sale of the Waldorf Astoria New York recognized in general, administrative and other expenses. The amounts for the three and nine months ended September 30, 2015 relate primarily to the net gains on the sale of the Waldorf Astoria New York and Hilton Sydney, as well as amounts recognized in relation to the sale of the Waldorf Astoria New York and the properties acquired from the proceeds of that sale. The amounts are detailed as follows: | |
|
Three Months Ended |
Nine Months Ended |
||||||||||
|
September 30, 2015 |
September 30, 2015 |
||||||||||
|
Gain on sale of the Waldorf Astoria New York and Hilton Sydney, net of transaction costs |
$ |
(164 |
) |
$ |
(306 |
) |
|||||
|
Severance costs |
35 |
89 |
|||||||||
|
Transaction costs related to property acquisitions |
— |
26 |
|||||||||
|
Reduction of unamortized management contract intangible asset related to properties that were managed by Hilton prior to acquisition |
— |
13 |
|||||||||
|
Reduction of remaining deferred issuance costs related to the mortgage loan secured by the Waldorf Astoria New York |
— |
6 |
|||||||||
|
$ |
(129 |
) |
$ |
(172 |
) |
||||||
| (4) | In June 2015, one of Hilton's consolidated properties modified the terms of its lease agreement, resulting in a reduction in the capital lease obligation and recognition of a gain included in other gain (loss), net. | |
| (5) | Expense was recognized in general, administrative and other expenses related to costs incurred in connection with a secondary equity offering by certain selling stockholders. | |
| (6) | These amounts represent expenses incurred in connection with the Financing Transactions for the planned spin-offs of Park and HGV, which included $5 million recognized in interest expense and $9 million recognized in other gain (loss), net. | |
| (7) | The amount for the nine months ended September 30, 2016 relates to the release of reserves of unrecognized tax benefits that Hilton has either settled or determined that Hilton was more likely than not to receive the full benefit for. The amount for the nine months ended September 30, 2015 includes the effect of the reduction in the statutory tax rate on March 31, 2015 in a foreign jurisdiction where the Company had deferred tax assets, resulting in a reduction to the deferred tax asset and a corresponding recognition of income tax expense of $6 million, including $2 million attributable to noncontrolling interests. These amounts were recognized in income tax expense. | |
| HILTON WORLDWIDE HOLDINGS INC. | ||||||||||||||||
| NON-GAAP FINANCIAL MEASURES RECONCILIATIONS | ||||||||||||||||
| ADJUSTED EBITDA AND ADJUSTED EBITDA MARGIN | ||||||||||||||||
| (unaudited, dollars in millions) | ||||||||||||||||
| Three Months Ended | Nine Months Ended | |||||||||||||||
| September 30, | September 30, | |||||||||||||||
| 2016 | 2015 | 2016 | 2015 | |||||||||||||
| Net income | $ | 192 | $ | 283 | $ | 746 | $ | 600 | ||||||||
| Interest expense | 148 | 138 | 434 | 431 | ||||||||||||
| Income tax expense | 145 | 247 | 255 | 555 | ||||||||||||
| Depreciation and amortization | 169 | 171 | 509 | 519 | ||||||||||||
| Interest expense, income tax and depreciation and amortization included in equity in earnings from unconsolidated affiliates | 8 | 6 | 23 | 20 | ||||||||||||
| EBITDA | 662 | 845 | 1,967 | 2,125 | ||||||||||||
| Gain on sales of assets, net | — | (164 | ) | (2 | ) | (306 | ) | |||||||||
| Loss on foreign currency transactions | 8 | 8 | 33 | 21 | ||||||||||||
| FF&E replacement reserve | 13 | 9 | 42 | 36 | ||||||||||||
| Share-based compensation expense | 26 | 21 | 70 | 143 | ||||||||||||
| Impairment loss | — | — | 15 | — | ||||||||||||
| Other loss (gain), net(1) | 10 | (1 | ) | 15 | 6 | |||||||||||
| Other adjustment items(2) | 46 | 40 | 84 | 109 | ||||||||||||
| Adjusted EBITDA | $ | 765 | $ | 758 | $ | 2,224 | $ | 2,134 | ||||||||
| ____________ | ||
|
(1) |
Represents costs related primarily to the Financing Transactions and acquisitions of property and equipment, as well as a loss related to a disposition of property and equipment. |
|
| (2) |
Represents adjustments for spin-off and reorganization costs, severance and other items. |
|
| Three Months Ended | Nine Months Ended | |||||||||||||||
| September 30, | September 30, | |||||||||||||||
| 2016 | 2015 | 2016 | 2015 | |||||||||||||
| Total revenues, as reported | $ | 2,942 | $ | 2,895 | $ | 8,743 | $ | 8,416 | ||||||||
| Less: other revenues from managed and franchised properties | (1,105 | ) | (1,063 | ) | (3,342 | ) | (3,074 | ) | ||||||||
| Total revenues, excluding other revenues from managed and franchised properties | $ | 1,837 | $ | 1,832 | $ | 5,401 | $ | 5,342 | ||||||||
| Adjusted EBITDA | $ | 765 | $ | 758 | $ | 2,224 | $ | 2,134 | ||||||||
| Adjusted EBITDA margin | 41.6 | % | 41.4 | % | 41.2 | % | 39.9 | % | ||||||||
| HILTON WORLDWIDE HOLDINGS INC. | ||||||||
| NON-GAAP FINANCIAL MEASURES RECONCILIATIONS | ||||||||
| NET DEBT AND NET DEBT TO ADJUSTED EBITDA RATIO | ||||||||
| (unaudited, in millions) | ||||||||
| September 30, | December 31, | |||||||
| 2016 | 2015 | |||||||
| Long-term debt, including current maturities | $ | 9,984 | $ | 9,951 | ||||
| Add: unamortized deferred financing costs | 88 | 90 | ||||||
| Long-term debt, including current maturities and excluding unamortized deferred financing costs | 10,072 | 10,041 | ||||||
| Add: Hilton's share of unconsolidated affiliate debt, excluding unamortized deferred financing costs | 226 | 229 | ||||||
| Less: cash and cash equivalents | (859 | ) | (609 | ) | ||||
| Less: restricted cash and cash equivalents | (272 | ) | (247 | ) | ||||
| Net debt | $ | 9,167 | $ | 9,414 | ||||
| Nine Months Ended | Year Ended | TTM(1) | ||||||||||||||
| September 30, | December 31, | September 30, | ||||||||||||||
| 2016 | 2015 | 2015 | 2016 | |||||||||||||
| Net income | $ | 746 | $ | 600 | $ | 1,416 | $ | 1,562 | ||||||||
| Interest expense | 434 | 431 | 575 | 578 | ||||||||||||
| Income tax expense (benefit) | 255 | 555 | 80 | (220 | ) | |||||||||||
| Depreciation and amortization | 509 | 519 | 692 | 682 | ||||||||||||
| Interest expense, income tax and depreciation and amortization included in equity in earnings from unconsolidated affiliates | 23 | 20 | 32 | 35 | ||||||||||||
| EBITDA | 1,967 | 2,125 | 2,795 | 2,637 | ||||||||||||
| Gain on sales of assets, net | (2 | ) | (306 | ) | (306 | ) | (2 | ) | ||||||||
| Loss on foreign currency transactions | 33 | 21 | 41 | 53 | ||||||||||||
| FF&E replacement reserve | 42 | 36 | 48 | 54 | ||||||||||||
| Share-based compensation expense | 70 | 143 | 162 | 89 | ||||||||||||
| Impairment loss | 15 | — | 9 | 24 | ||||||||||||
| Other loss, net(2) | 15 | 6 | 1 | 10 | ||||||||||||
| Other adjustment items(3) | 84 | 109 | 129 | 104 | ||||||||||||
| Adjusted EBITDA | $ | 2,224 | $ | 2,134 | $ | 2,879 | $ | 2,969 | ||||||||
| Net debt | $ | 9,167 | ||||||||||||||
| Net debt to Adjusted EBITDA ratio | 3.1 | |||||||||||||||
| ____________ | ||
| (1) |
Trailing twelve months ("TTM") September 30, 2016 is calculated as nine months ended September 30, 2016 plus year ended December 31, 2015 less nine months ended September 30, 2015. |
|
| (2) |
For the nine months ended September 30, 2016, primarily includes costs related to the Financing Transactions. For the nine months ended September 30, 2015, primarily represents gains and losses on the acquisitions and dispositions of property and equipment and lease restructuring transactions. |
|
| (3) |
Represents adjustments for spin-off and reorganization costs, severance, offering costs and other items. |
|
| HILTON WORLDWIDE HOLDINGS INC. | |||||||
| NON-GAAP FINANCIAL MEASURES RECONCILIATIONS | |||||||
| OUTLOOK: ADJUSTED EBITDA | |||||||
| FORECASTED 2016 | |||||||
| (unaudited, in millions) | |||||||
|
Three Months Ending |
|||||||
| Low Case | High Case | ||||||
| Net income | $ | 202 | $ | 235 | |||
| Interest expense | 145 | 145 | |||||
| Income tax expense | 133 | 155 | |||||
| Depreciation and amortization | 174 | 174 | |||||
| Interest expense, income tax and depreciation and amortization included in equity in earnings from unconsolidated affiliates | 8 | 8 | |||||
| EBITDA | 662 | 717 | |||||
| FF&E replacement reserve | 11 | 11 | |||||
| Share-based compensation expense | 23 | 23 | |||||
| Other adjustment items(1) | 40 | 15 | |||||
| Adjusted EBITDA | $ | 736 | $ | 766 | |||
|
Year Ending |
|||||||
| Low Case | High Case | ||||||
| Net income | $ | 948 | $ | 981 | |||
| Interest expense | 579 | 579 | |||||
| Income tax expense | 388 | 410 | |||||
| Depreciation and amortization | 683 | 683 | |||||
| Interest expense, income tax and depreciation and amortization included in equity in earnings from unconsolidated affiliates | 31 | 31 | |||||
| EBITDA | 2,629 | 2,684 | |||||
| Loss on foreign currency transactions | 33 | 33 | |||||
| FF&E replacement reserve | 53 | 53 | |||||
| Share-based compensation expense | 93 | 93 | |||||
| Impairment loss | 15 | 15 | |||||
| Other adjustment items(1) | 137 | 112 | |||||
| Adjusted EBITDA | $ | 2,960 | $ | 2,990 | |||
| ____________ | ||
| (1) |
Represents adjustments for spin-offs and reorganization costs, severance and other items. |
|
| HILTON WORLDWIDE HOLDINGS INC. | ||||||||
| NON-GAAP FINANCIAL MEASURES RECONCILIATIONS | ||||||||
| OUTLOOK: NET INCOME AND DILUTED EPS, ADJUSTED FOR SPECIAL ITEMS | ||||||||
| FORECASTED 2016 | ||||||||
| (unaudited, in millions, except per share data) | ||||||||
|
Three Months Ending |
||||||||
| Low Case | High Case | |||||||
| Net income attributable to Hilton stockholders, before special items | $ | 198 | $ | 231 | ||||
| Diluted EPS, before special items | $ | 0.20 | $ | 0.23 | ||||
| Net income attributable to Hilton stockholders, adjusted for special items | $ | 198 | $ | 231 | ||||
| Diluted EPS, adjusted for special items | $ | 0.20 | $ | 0.23 | ||||
|
Year Ending |
||||||||
| Low Case | High Case | |||||||
| Net income attributable to Hilton stockholders, before special items | $ | 933 | $ | 966 | ||||
| Diluted EPS, before special items | $ | 0.94 | $ | 0.97 | ||||
| Special items(1): | ||||||||
| Impairment loss | $ | 15 | $ | 15 | ||||
| Costs incurred for planned spin-offs | 54 | 54 | ||||||
| Asset disposition | 18 | 18 | ||||||
| Financing transactions | 14 | 14 | ||||||
| Tax-related adjustment | (153 | ) | (153 | ) | ||||
| Total special items before tax | (52 | ) | (52 | ) | ||||
| Income tax expense on special items | (30 | ) | (30 | ) | ||||
| Total special items after tax | $ | (82 | ) | $ | (82 | ) | ||
| Net income attributable to Hilton stockholders, adjusted for special items | $ | 851 | $ | 884 | ||||
| Diluted EPS, adjusted for special items | $ | 0.86 | $ | 0.89 | ||||
| ____________ | ||
| (1) |
See "Net Income and EPS, Adjusted for Special Items" for details of these special items. |
|
HILTON WORLDWIDE HOLDINGS INC.
DEFINITIONS
EBITDA, Adjusted EBITDA and Adjusted EBITDA Margin
Earnings before interest expense, taxes and depreciation and amortization ("EBITDA"), presented herein, is a financial measure not recognized under United States ("U.S.") generally accepted accounting principles ("GAAP") that reflects net income, excluding interest expense, a provision for income taxes and depreciation and amortization. The Company considers EBITDA to be a useful measure of operating performance, due to the significance of the Company's long-lived assets and level of indebtedness.
Adjusted EBITDA, presented herein, is calculated as EBITDA, as previously defined, further adjusted to exclude certain items, including gains, losses and expenses in connection with: (i) asset dispositions for both consolidated and unconsolidated investments; (ii) foreign currency transactions; (iii) debt restructurings/retirements; (iv) non-cash impairment losses; (v) furniture, fixtures and equipment ("FF&E") replacement reserves required under certain lease agreements; (vi) reorganization costs; (vii) share-based compensation expense; (viii) severance, relocation and other expenses; and (ix) other items.
Adjusted EBITDA margin represents Adjusted EBITDA as a percentage of total revenues, excluding other revenues from managed and franchised properties.
EBITDA, Adjusted EBITDA and Adjusted EBITDA margin are not recognized terms under U.S. GAAP and should not be considered as alternatives to net income (loss) or other measures of financial performance or liquidity derived in accordance with U.S. GAAP. In addition, the Company's definitions of EBITDA, Adjusted EBITDA and Adjusted EBITDA margin may not be comparable to similarly titled measures of other companies.
The Company believes that EBITDA, Adjusted EBITDA and Adjusted EBITDA margin provide useful information to investors about the Company and its financial condition and results of operations for the following reasons: (i) these measures are among the measures used by the Company's management team to evaluate its operating performance and make day-to-day operating decisions; and (ii) these measures are frequently used by securities analysts, investors and other interested parties as a common performance measure to compare results or estimate valuations across companies in the industry.
EBITDA, Adjusted EBITDA and Adjusted EBITDA margin have limitations as analytical tools and should not be considered either in isolation or as a substitute for net income (loss), cash flow or other methods of analyzing results as reported under U.S. GAAP.
Net Income and EPS, Adjusted for Special Items
Net income and EPS, adjusted for special items, are not recognized terms under U.S. GAAP and should not be considered as alternatives to net income (loss) or other measures of financial performance or liquidity derived in accordance with U.S. GAAP. In addition, the Company's definition of Net income and EPS, adjusted for special items, may not be comparable to similarly titled measures of other companies.
Net income and EPS, adjusted for special items, are included to assist investors in performing meaningful comparisons of past, present and future operating results and as a means of highlighting the results of the Company's ongoing operations.
Net Debt
Net debt, presented herein, is a non-GAAP financial measure that the Company uses to evaluate its financial leverage. Net debt is calculated as (i) long-term debt, including current maturities and excluding unamortized deferred financing costs; and (ii) the Company's share of investments in affiliate debt, excluding unamortized deferred financing costs; reduced by (a) cash and cash equivalents; and (b) restricted cash and cash equivalents.
The Company believes Net debt provides useful information about its indebtedness to investors as it is frequently used by securities analysts, investors and other interested parties to compare the indebtedness of companies. Net debt should not be considered as a substitute to debt presented in accordance with U.S. GAAP. Net debt may not be comparable to a similarly titled measure of other companies.
Net Debt to Adjusted EBITDA Ratio
Net debt to Adjusted EBITDA ratio, presented herein, is a non-GAAP financial measure and is included as it is frequently used by securities analysts, investors and other interested parties to compare the financial condition of companies. Net debt to Adjusted EBITDA ratio should not be considered as an alternative to measures of financial condition derived in accordance with U.S. GAAP and it may not be comparable to a similarly titled measure of other companies.
Comparable Hotels
The Company defines comparable hotels as those that: (i) were active and operating in the Company's system for at least one full calendar year as of the end of the current period, and open January 1st of the previous year; (ii) have not undergone a change in brand or ownership during the current or comparable periods reported; and (iii) have not sustained substantial property damage, business interruption, undergone large-scale capital projects or for which comparable results are not available.
Of the 4,774 hotels in the Company's system as of September 30, 2016, 3,760 were classified as comparable hotels. The 1,014 non-comparable hotels included 151 properties, or approximately three percent of the total hotels in the system, that were removed from the comparable group during the last twelve months because they sustained substantial property damage, business interruption, underwent large-scale capital projects or comparable results were not available.
Occupancy
Occupancy represents the total number of room nights sold divided by the total number of room nights available at a hotel or group of hotels. Occupancy measures the utilization of the hotels' available capacity. Management uses occupancy to gauge demand at a specific hotel or group of hotels in a given period. Occupancy levels also help management determine achievable Average Daily Rate levels as demand for hotel rooms increases or decreases.
Average Daily Rate ("ADR")
ADR represents hotel room revenue divided by total number of room nights sold in a given period. ADR measures average room price attained by a hotel and ADR trends provide useful information concerning the pricing environment and the nature of the customer base of a hotel or group of hotels. ADR is a commonly used performance measure in the industry, and management uses ADR to assess pricing levels that the Company is able to generate by type of customer, as changes in rates have a different effect on overall revenues and incremental profitability than changes in occupancy, as described above.
Revenue per Available Room ("RevPAR")
The Company calculates RevPAR by dividing hotel room revenue by total number of room nights available to guests for a given period. Management considers RevPAR to be a meaningful indicator of the Company's performance as it provides a metric correlated to two primary and key drivers of operations at a hotel or group of hotels: occupancy and ADR. RevPAR is also a useful indicator in measuring performance over comparable periods for comparable hotels.
References to RevPAR, ADR and occupancy throughout this press release are presented on a comparable basis and references to RevPAR and ADR are presented on a currency neutral basis (all periods use the same exchange rates), unless otherwise noted.